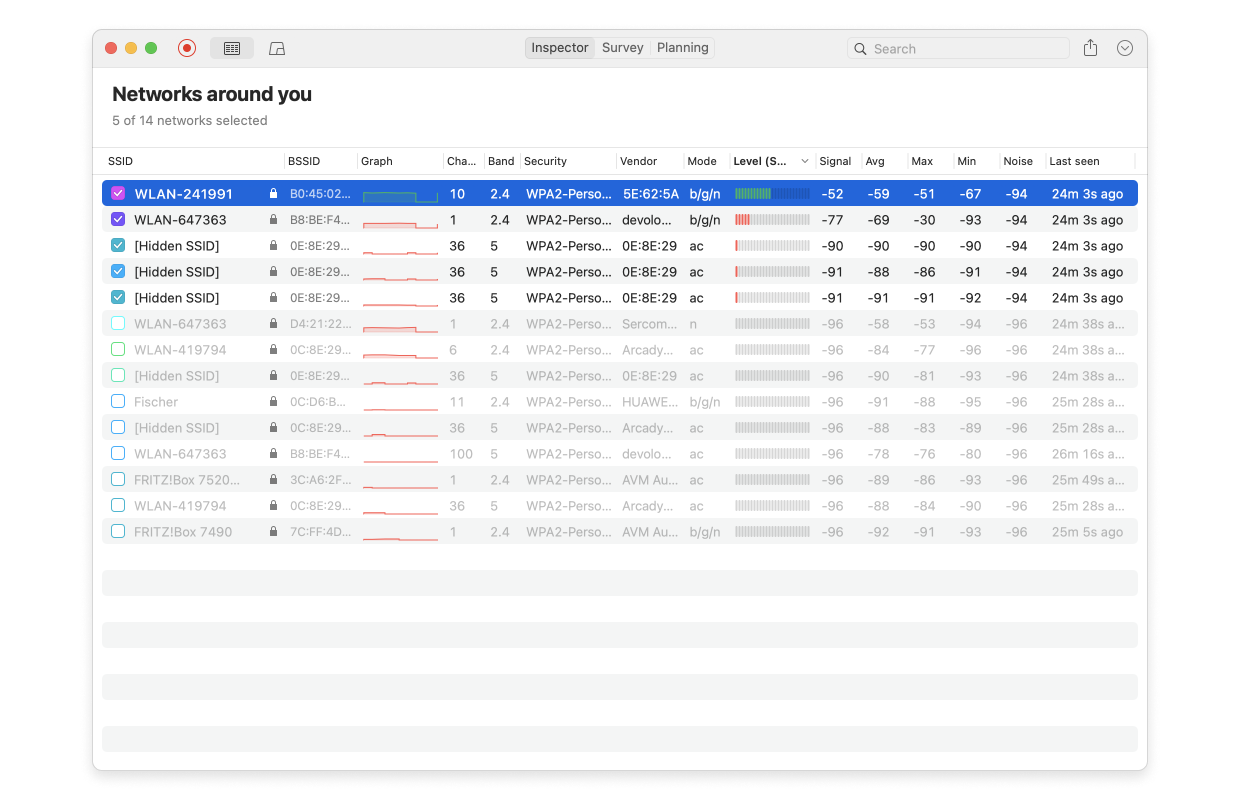
When you don’t need to perform a full wireless site survey, but rather require a quick overview of the surrounding WiFi networks, use Inspector Mode in NetSpot to analyze the WiFi networks in vicinity by gathering their real-time data.
Open NetSpot and switch to the Inspector mode by clicking the corresponding option at the top of the app window.

Now wait for the collected data to start showing up. During the scanning for data you have several options:
- To stop the data refresh, click Stop on the upper-left. The button will change its appearance and color to red. Click it to continue data collection from all discovered networks.
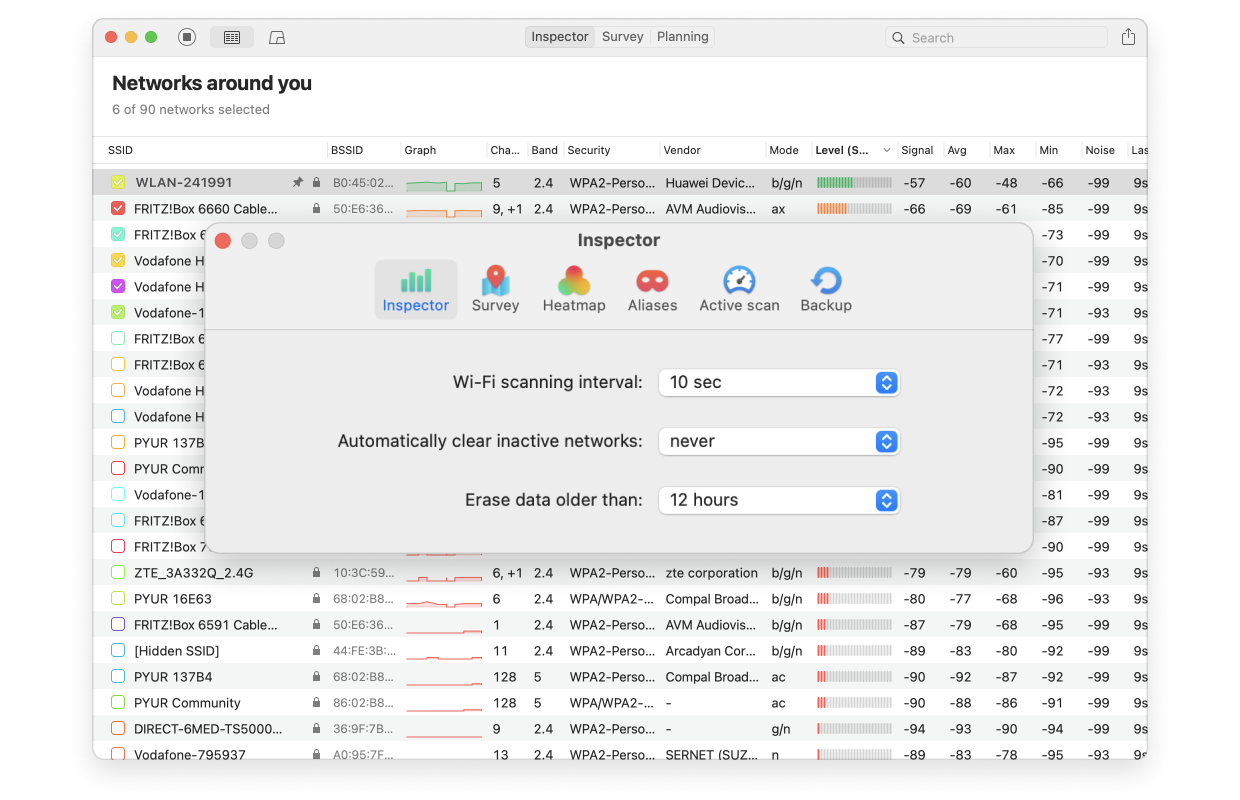
- To adjust the data refresh interval (10, 30 or 60 seconds), use the NetSpot menu > Settings… > Inspector > WiFi scanning interval.
- To automatically clear inactive networks, go to NetSpot menu > Settings… > Inspector > Automatically clear inactive networks. By default this option is set to Never. You can set the inactive networks to be cleared automatically after 1, 5, 10, 30 or 60 minutes. This is only to remove inactive networks — active networks data will continue to be refreshed.
- To clear all the collected data, go to go to NetSpot menu > Settings… > Inspector > Erase data older than. By default this option is set to 12 hours, you can also set it to 24 hours, or — to Never if you’d like to retain all the data that’s been collected.

- Not all columns with collected data are shown by default. To configure which data to display, right-click on the table header and tick the needed items.
- Click on the column name to sort the data by that heading.
- Pin the networks you’d like to always stay on top of the list.
- To search for and filter the displayed networks, use the Search box at the top right.

- NetSpot PRO and Enterprise allow exporting the collected data to a .csv file. Click the Export button at the top right of the app window. Each network’s data is exported in a separate CSV file with its historical values by time for further processing.
Viewing Network Details
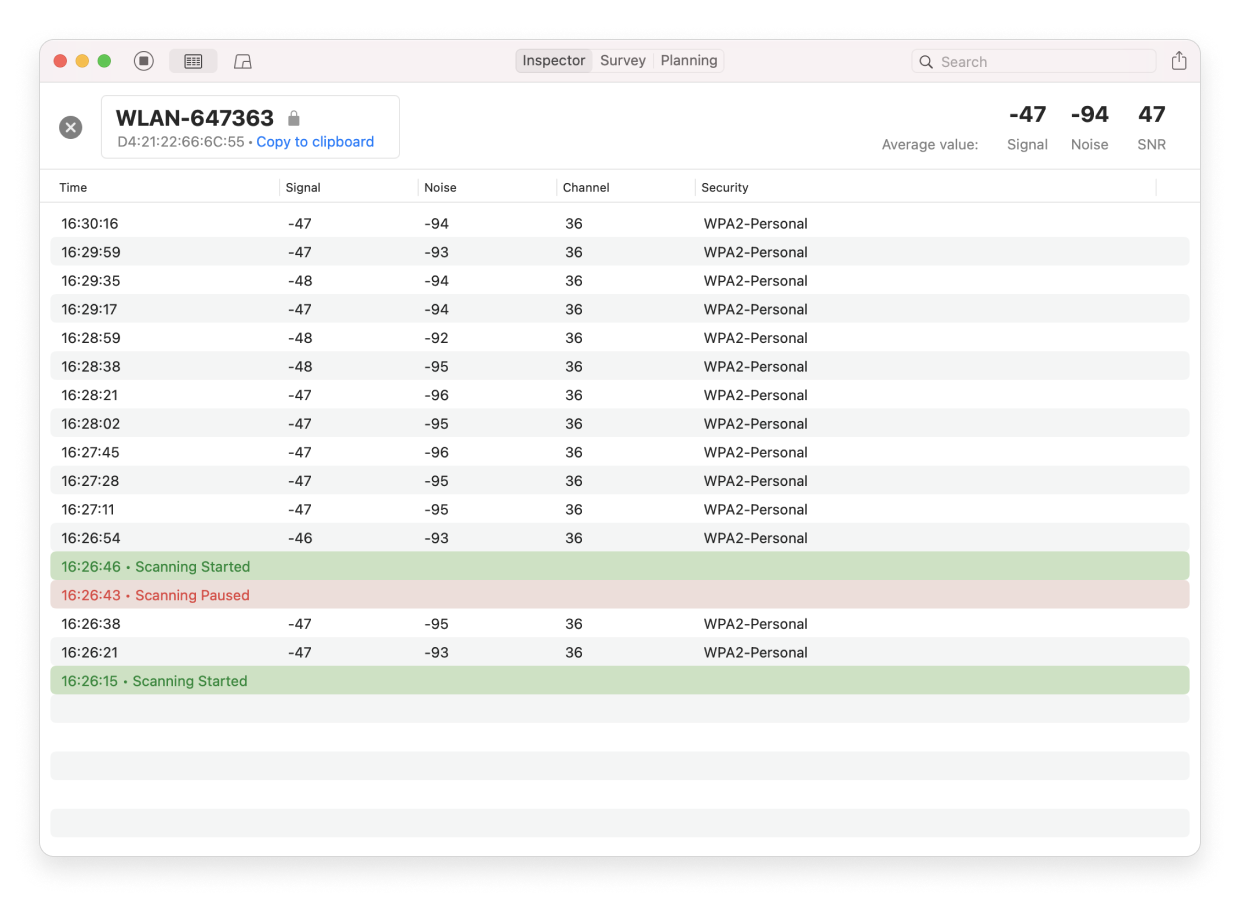
You can view each network’s data log individually. To do that — double-click anywhere on the network data in the table.

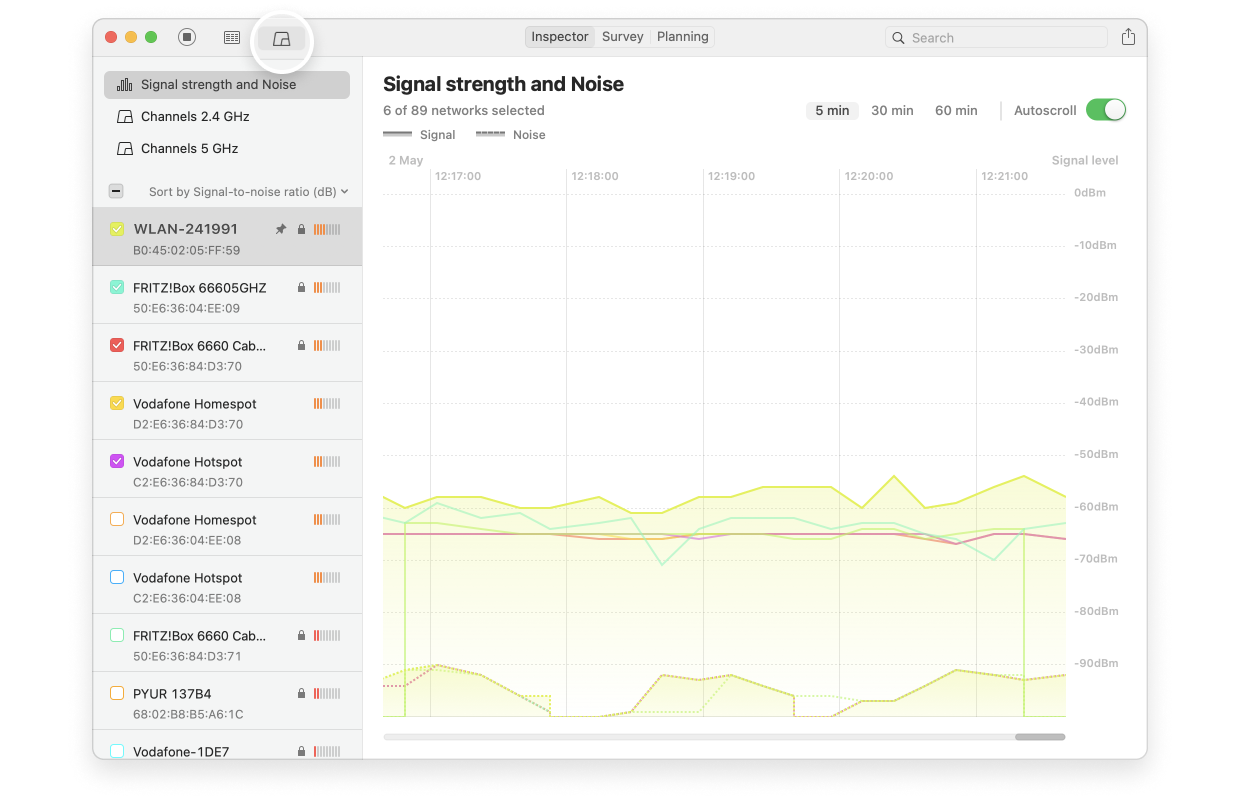
Signal level and noise graphs can be viewed by clicking on the “Signal level and noise graphs” button at the top left of the app window.

- All selected networks will be shown in the Details view, matching their assigned color. By checking and unchecking the boxes, you can change what is shown in graphs. Clicking on a colored line on any of the graphs will automatically select the corresponding network in the main Inspector tab.
- The Graphs window has three following options:
- Signal strength & Noise: The signal and noise levels are shown in real-time as a graph. Any network that you highlight in the main Inspector window will be highlighted on the graph as well. Use the horizontal scroll at the bottom of the window to move backwards in time. Hold down the Shift key to scroll with your touchpad or mouse wheel. If the “Autoscroll” box at the top right is checked, the graph will move automatically showing the most recent data on the right.
- Channels 2.4 GHz: The selected networks broadcasting at 2.4 GHz are shown, as well as the range of channels that they cover. This allows you to see where channels are overlapping. By default, the “Show average value for inactive networks” option at the top right is enabled. This way any currently inactive networks will be shown at their average known values. If you uncheck the box, inactive networks will not be shown at all. Inactive networks are represented by dotted lines, while the active ones — by solid.
- Channels 5 GHz and 6 GHz: Everything is just the same as for the 2.4 GHz channels described in the previous abstract.
Network information provided
The following information is available for each detected network:
- SSID — the network name. If you see the padlock icon next to it, that means this network is password-protected
- BSSID — BSSID – MAC address
- Alias — the AP alias, double-click to add one
- Graph — the visual representation of the signal level
- Signal — the signal level RSSI in dBm. The closer it is to zero, the stronger the signal is
- Signal % — 100% being the best
- Channel — 1, 6, 11, etc. NetSpot also lists additional channels, it’s important to know it, as it actually influences the interference parameters. If you see a channel listed as X,+1, the channel is expanded towards a larger number, if it’s something like X,-1, it’s been reduced
- Frequency — the channel base frequency
- Channel width — 20, 40, 80 or 160 MHz
- Band — 2.4 GHz, 5 GHz, 6 GHz (the latter available for those adapters that support it)
- Security — WEP, WPA, WPA2, WPA3, etc.
- Vendor — manufacturer information for Access Points
- Type — network type: can be either “managed” (a regular wireless network with a router) or “ad-hoc”
- Mode — 802.11 a/b/g/n/ac/ax
- Level SNR — your Signal-to-Noise Ratio level on macOS, with higher numbers being better
- SNR — the actual signal-to-noise ratio in dB
- Avg — average signal level over the duration of the scan
- Max — maximum signal level registered during the scan
- Min — minimum signal level registered during the scan
- Noise — numbers closer to zero are worse
- Noise % — 100% being the worst
- Last seen — when the network was last detected since you started scanning