Wi-Fi Planning and Site Survey on Mac

NetSpot is the professional app for Wi-Fi Planning, wireless site surveys, Wi-Fi analysis, and troubleshooting on Mac OS. It's a FREE Wi-Fi analyzer. No need to be a network expert to improve your home or office Wi-Fi! All you need is your MacBook running Mac OS and NetSpot which works over any 802.11 network.

Also available on Windows

Inspector mode: Discover nearby WiFi networks

The Inspector mode makes NetSpot a perfect WiFi analyzer. You can review and study the information about your wireless network as well as the surrounding ones. Analyze nearby networks performance, APs configurations, signal level, channel interference, noise, etc.
The obtained data allows you to find the most suitable WiFi channel for your network, troubleshoot certain WiFi issues, etc.

  • featureAnalyze

    Discover access points

    Advanced filtering of discovered WiFi networks allows you to find and analyze networks according to their specific parameters. E.g. you can study the channel occupancy tendencies.
  • featureVisual

    Analyze and monitor

    Gather the real-time wireless data from all nearby networks and analyze it efficiently with the color-coded dBm data markers.
  • featureTshooting

    Troubleshoot WiFi

    With the help of graphs and charts, conveniently showing all collected data, you can identify the busiest and the least occupied channels. Switch to the least loaded channels for faster connection.

Wi-Fi Site Survey and Troubleshooting

The NetSpot survey tool allows collecting real-time WiFi data and building visual heatmaps on your Mac. There is no better way to study and analyze your WiFi coverage than seeing it clearly on color-coded heatmaps. WiFi heatmaps can help you make proper decisions on how to make your WiFi better. You can confidently identify the dead zones and work on plans on how to eliminate them and extend your wireless connection into every corner of a designated space. You can export all visualized data into a professional report.

  • featureAnalyze

    Mac WiFi Scanner

    Locate potential signal leakages, map out channel load, detect rogue access points with NetSpot WiFi channel scanner.
  • featureVisual

    Mac WiFi mapper

    Mapping your WiFi coverage provides great insight in your wireless network performance, making it easier to identify and eliminate problems with WiFi.
  • featureTshooting

    Mac WiFi Monitor

    Monitor your WiFi for possible signal, speed or agility issues - being on top of things will enable you to boost your WiFi performance quickly and efficiently.
Plan a new WiFi network
Experience time-efficient and productive WiFi planning with NetSpot. You will only need a MacBook or a Mac with our app installed to produce a great WiFi network plan and a thorough report on it.
Lifelike WiFi planning with real-life building materials
While planning a potential WiFi network setup, you can account for all real building materials used in your space along with their thickness and penetration properties.
Advanced rough out
When in need of a quick preliminary solution, rough out a map of the space with all of its walls, rooms, and furniture. This is a great quick start for making needed measurements for your future WiFi network.
Advanced sketching
"Try out" different routers
NetSpot allows you to try various WiFi routers without the need of actually spending a penny on a real thing. Once you see how different models can potentially perform in your space, you can make a practical choice.
Select a router model
Export report to PDF
Once your project is ready to be shared with others, you can save it to a secure professional report file.
Export report to PDF
Visualize with heatmaps
With all input data you have available for your planned WiFi network you can now create color-coded heatmaps that are an essential visual step of your future network rollout.
Predictive Visualizations

How to extend WiFi range

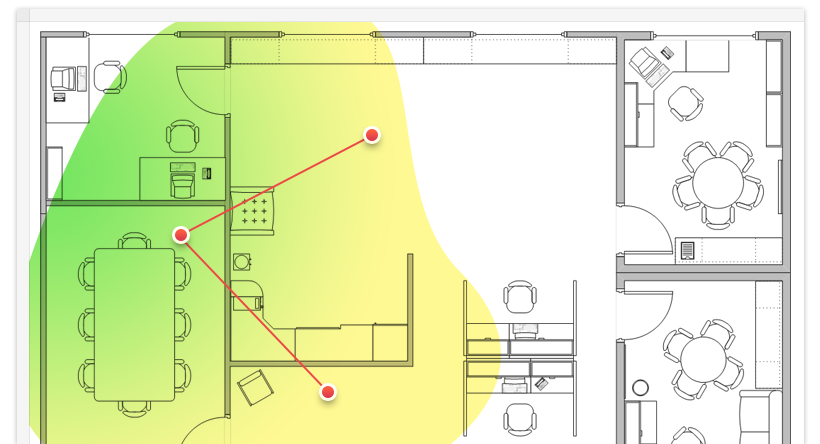
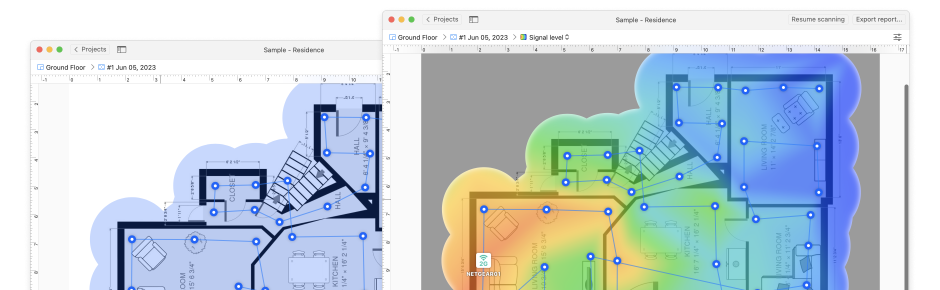
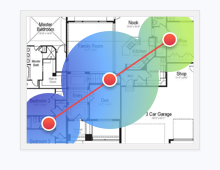
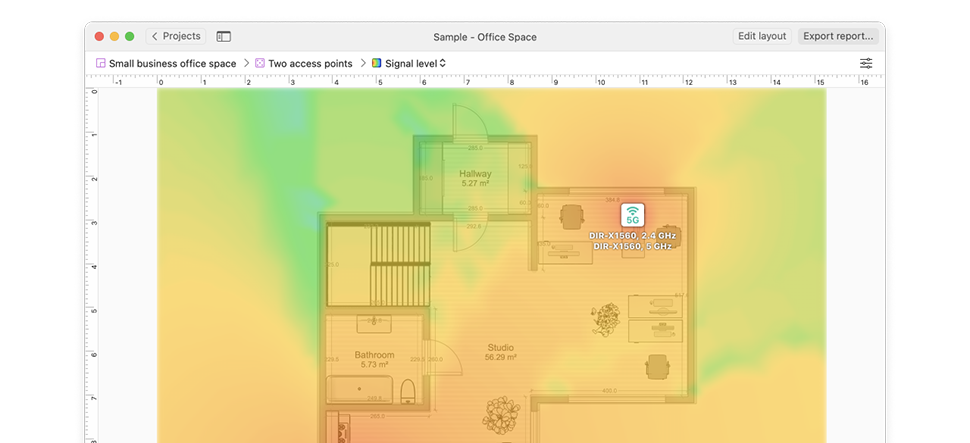
When working on a Wi-Fi network that will provide optimal coverage, you'll need to do solid research and to have an understanding of the radio frequency behavior on the spot. The effective way to obtain this information is a WiFi site survey.


A proper survey will reveal areas of channel interference and dead zones, and will help you tremendously in building a great network.


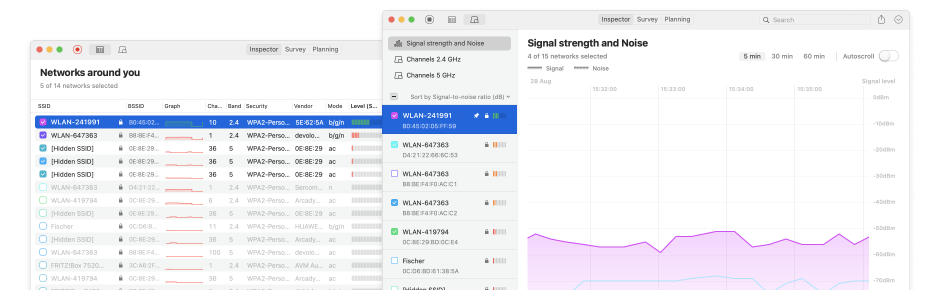
A dedicated Mac WiFi scanner is a must in extending WiFi signal! It will surely assist you in:


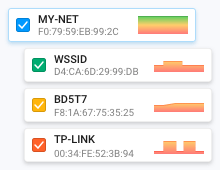
  • Analyzing WiFi channels and determining the best WiFi channel for your network
  • Identifying possible wireless interference issues
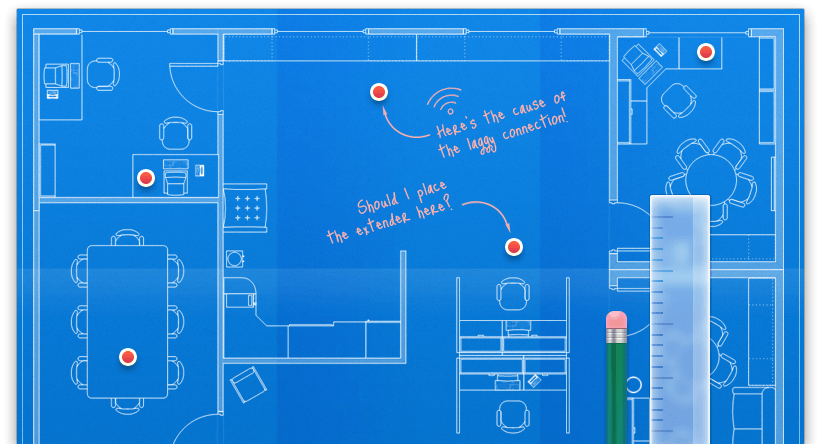
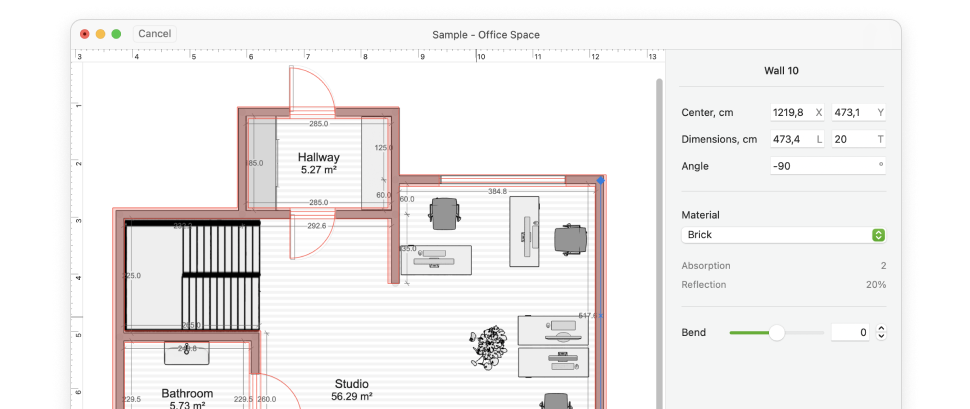
  • Finding a better placement for your router
  • Making a decision on either using a WiFi extender or installing a wireless mesh network
 featureTshooting

The best WiFi Site Survey software

The main goal of a WIFI site survey is determining the feasibility of implementing a wireless network in a specific area and finding the best spots for access points and other equipment like WiFi extenders, mesh network routers, cables and antennas. With the help of site survey you will know what type of equipment to get and where to install it.


Wireless site survey is also an important part of WiFi security analysis. NetSpot is a perfect WiFi survey Mac tool for network security specialists. One can use it to locate rogue access points or unauthorized workstations, avoid cross-channel interference, check the security settings (Open, WEP, WPA/WPA2 Personal/Enterprise), and of course troubleshoot the WiFi network performance in general.


With its advanced collection and visualization of data, NetSpot provides its users with a comprehensive and complete WiFi site survey solution.


NetSpot WiFi Site Survey software can:


  • Build comprehensive WiFi heatmaps with the gathered WiFi data
  • Help you discover sources of noise and interference
  • Identify the WiFi dead zones
  • Troubleshoot a variety of WiFi issues
featureVisualise

Wi-Fi planning

Whether you are building a new WiFi network from scratch or need to work with an existing setup to perfect it, NetSpot is an ultimate Wi-Fi planning tool. The Planning Mode in NetSpot allows you to create a map of your space taking building materials and their characteristics into consideration, "placing" the potential WiFi routers at the preferred locations, and seeing how this setup will work out and how you can tweak it to excellence.


You can "move" the routers around and play with their quantity in order to achieve the desired effect. It is easy to create a comprehensive WiFi planning report and export it in PDF.


NetSpot WiFi planning software allows you to:


  • Quickly draw a map of the space you are working on
  • Specify the building materials used throughout
  • Play with the WiFi routers placement to see how they'll work out
  • Create comprehensive predictive WiFi heatmaps
featurePlanning

Visualizations

According to scientists 90% of information transmitted to the brain is visual. So it is no wonder that color-coded heatmaps of a WiFi network built by NetSpot are the best way to compare, analyze and enhance the wireless coverage.
Passive scanning
Signal-to-noise ratio
Use this visualization to compare the level of your wireless signal to the noise in the background. The amount of outside interference at each measuring point qualifies as noise.
Signal level
Use this visualization to see the strength of your WiFi signal. This visualization offers great insight combined with other data, such as interference.
Signal-to-interference ratio
In this visualization you can see the correlation between the signal strength and the co-channel interference from other transmitters than the useful signal.
Quantity of access points
Use this as a reference on how many access points are already in use in your wireless network setup.
Noise level
This visualization is great when you need to see the level of outside interference determined at each point of measurement.
Frequency band coverage
This visualization is useful when you want to analyze which WiFi frequency bands are prevailing in different areas of your space.
PHY mode coverage
PHY rate is an important WiFi speed value dependent on the WiFi standard your network is operating on. This NetSpot visualization shows how 802.11a/b/g/n/ac/ax modulations are distributed in your wireless setup.
Active scanning
Download speed
This type of speed visualization indicates the amount of data transferred from the Internet to a user's computer within a given time frame.
Upload speed
This type of speed visualization indicates the amount of data transferred from the user's computer to the Internet within a given time.
Wireless transmit rate
Refer to this visualization to evaluate the speed of data transfer from an access point to a wireless device.
Iperf3 upload, download, and jitter
These are great ways to test bandwidth performance and subsequently optimize your wireless network.
Troubleshooting
Low signal level
The areas where the signal is hardly reaching will be clearly identifiable in this visualization. You can then make a decision on how to boost the WiFi signal into every corner of your WiFi covered space.
High level of noise
The higher the noise level, the worse connectivity you may have, to the point that there is no connectivity in some areas, effectively creating "dead zones" that are so undesirable in any WiFi network setup.
Issues with SNR
With the help of this visualization you can spot the areas where the signal strength is heavily affected by the level of noise.
Overlapping channels (SIR)
To maximize your WiFi performance you need to choose your channels wisely. With this visualization you can easily see where the channels overlap, the signal hits lower levels, and the upload and download rates are underperforming.
NetSpot for Mac and Windows
Runs on any MacBook (macOS 10.12+) or any laptop (Windows 7/8/10/11) with a standard 802.11a/b/g/n/ac/ax wireless network adapter.
★★★★
4.8 score, based on 969 user reviews
Version 3.2 • Submit your review