The nearby networks at your fingertips
Get all the network information you need for the most optimal wireless router setup.
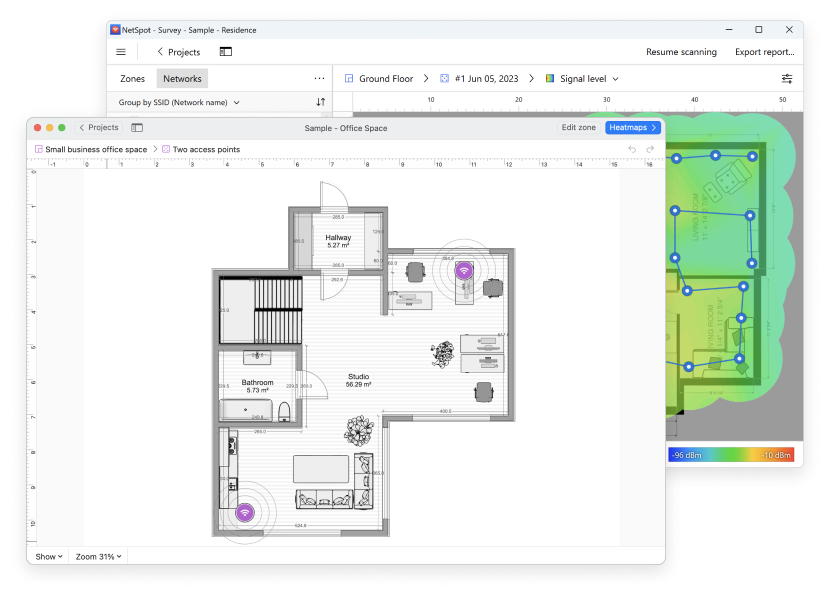
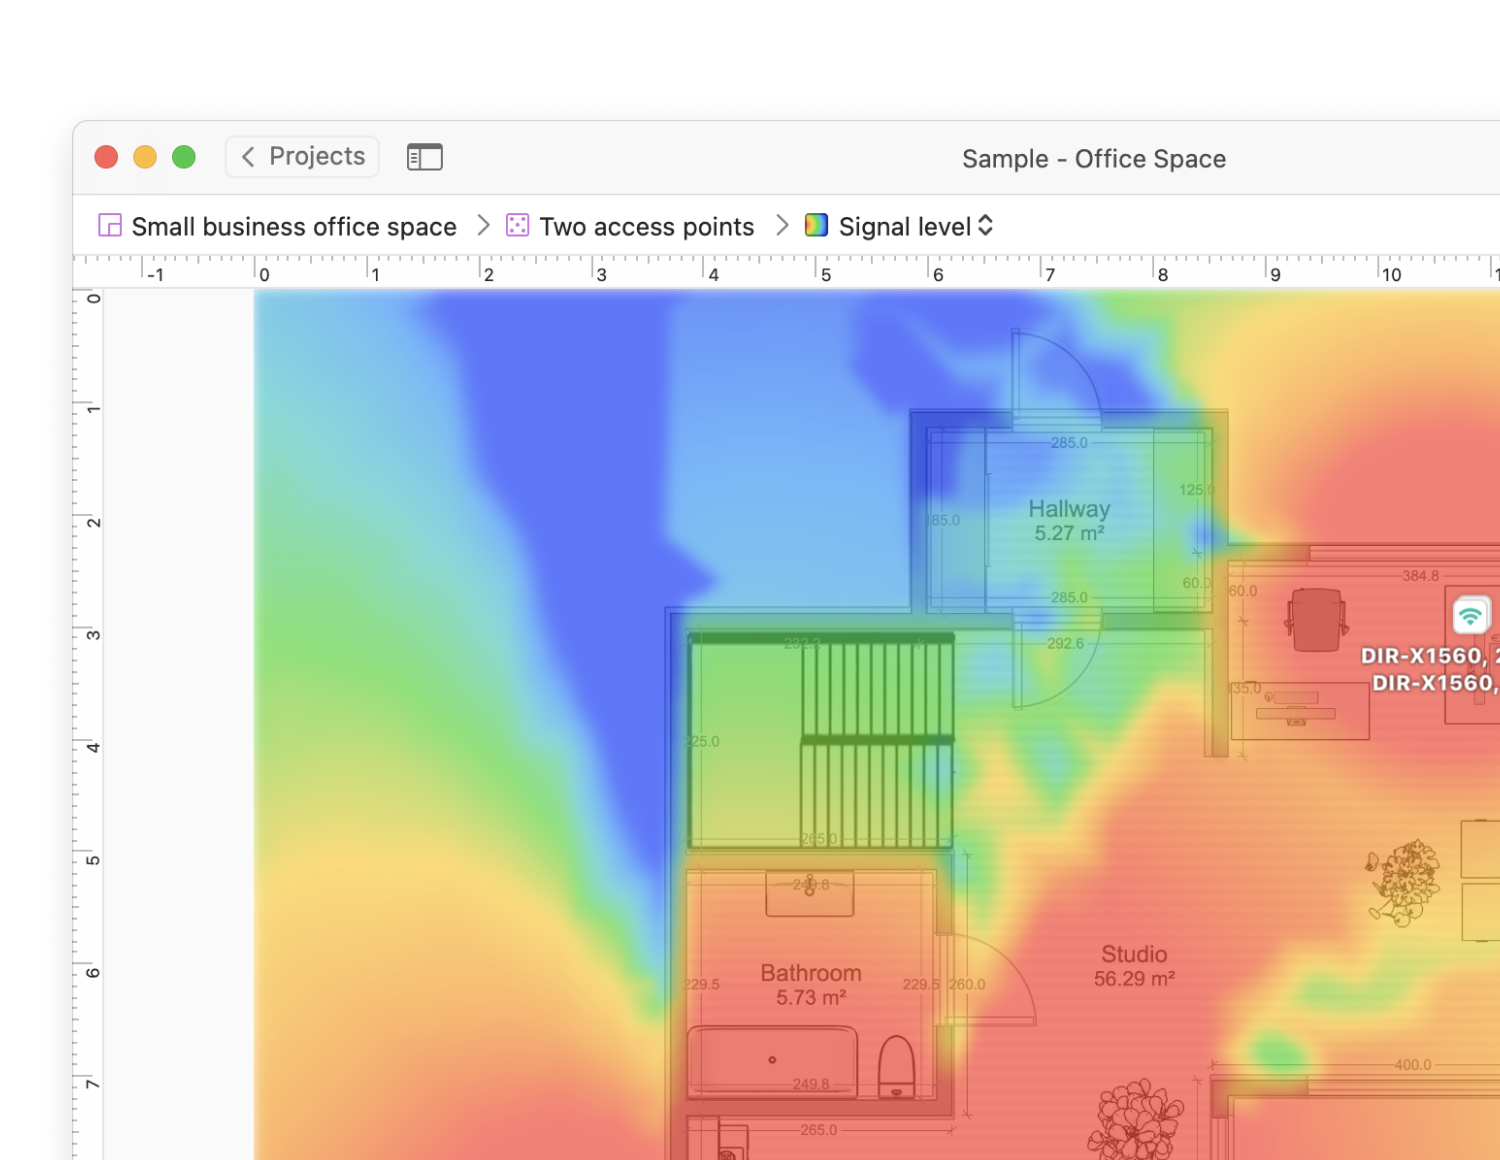
Wi-Fi planning and surveys are the key directions in NetSpot. You can plan new wireless networks, run a wireless survey and create WiFi coverage visualizations all in one friendly app. 20+ heatmap coverage graphs are available with powerful customizable reports.


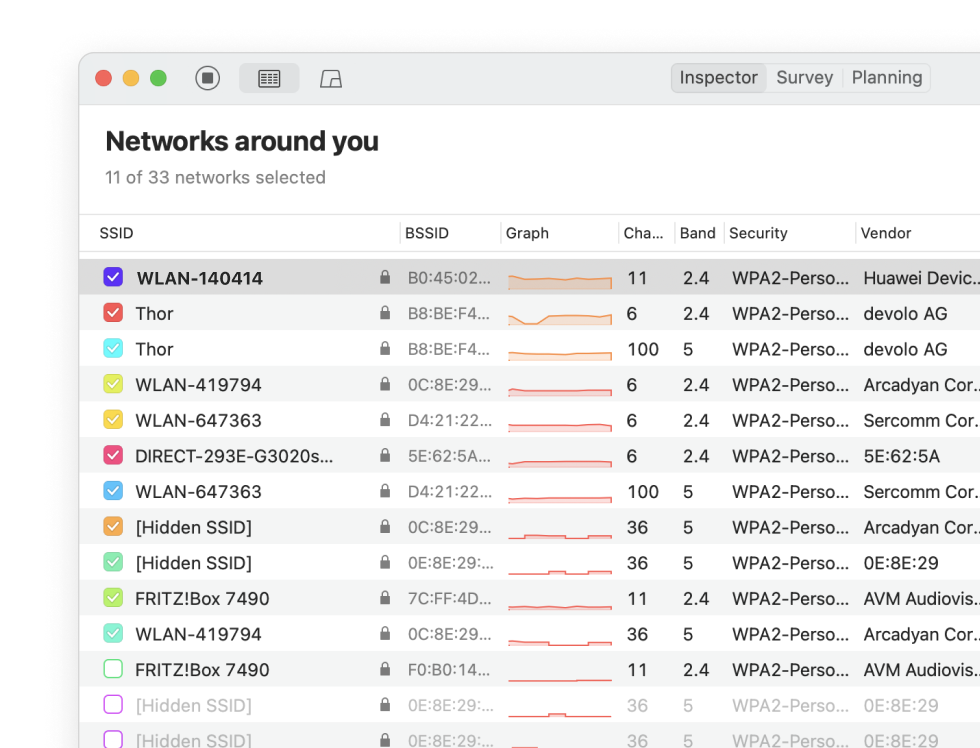
Free NetSpot collects every detail about surrounding Wi-Fi networks and presents wireless data as an interactive table. It lets you troubleshoot and improve your network's coverage, capacity, performance, APs configurations, signal level, interference, noise, etc.
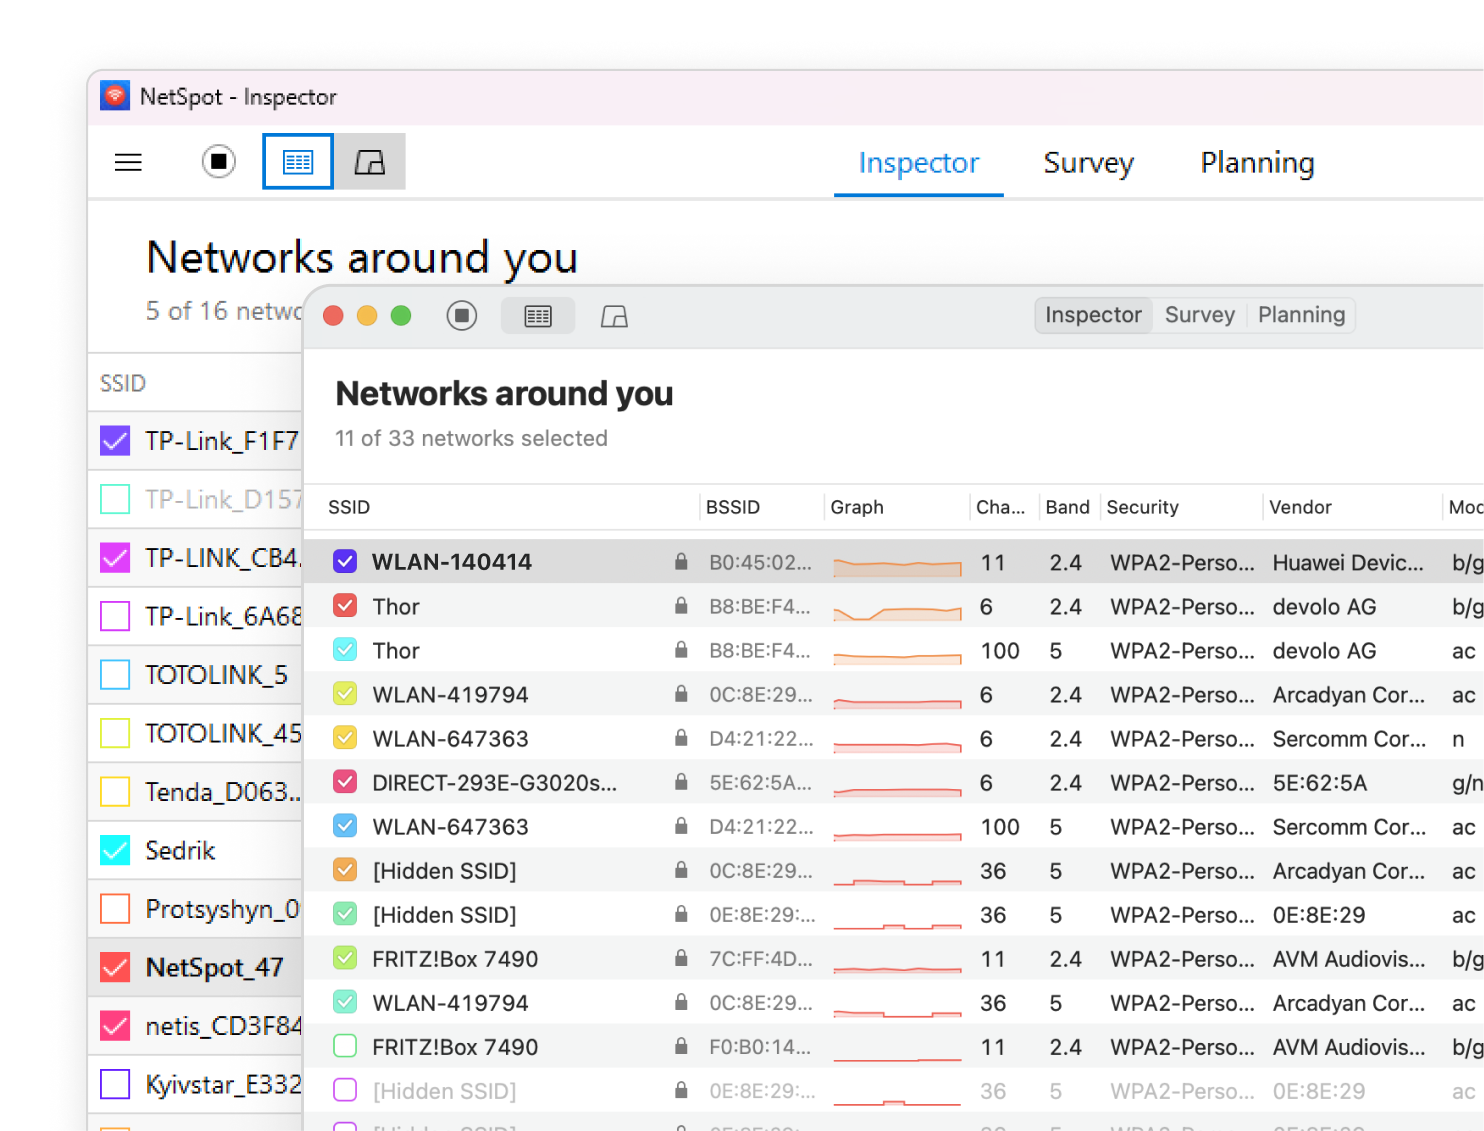
The networks found around your location are presented in a convenient manner — easily spot those you need with info like name, BSSID, router brand, channel, etc.
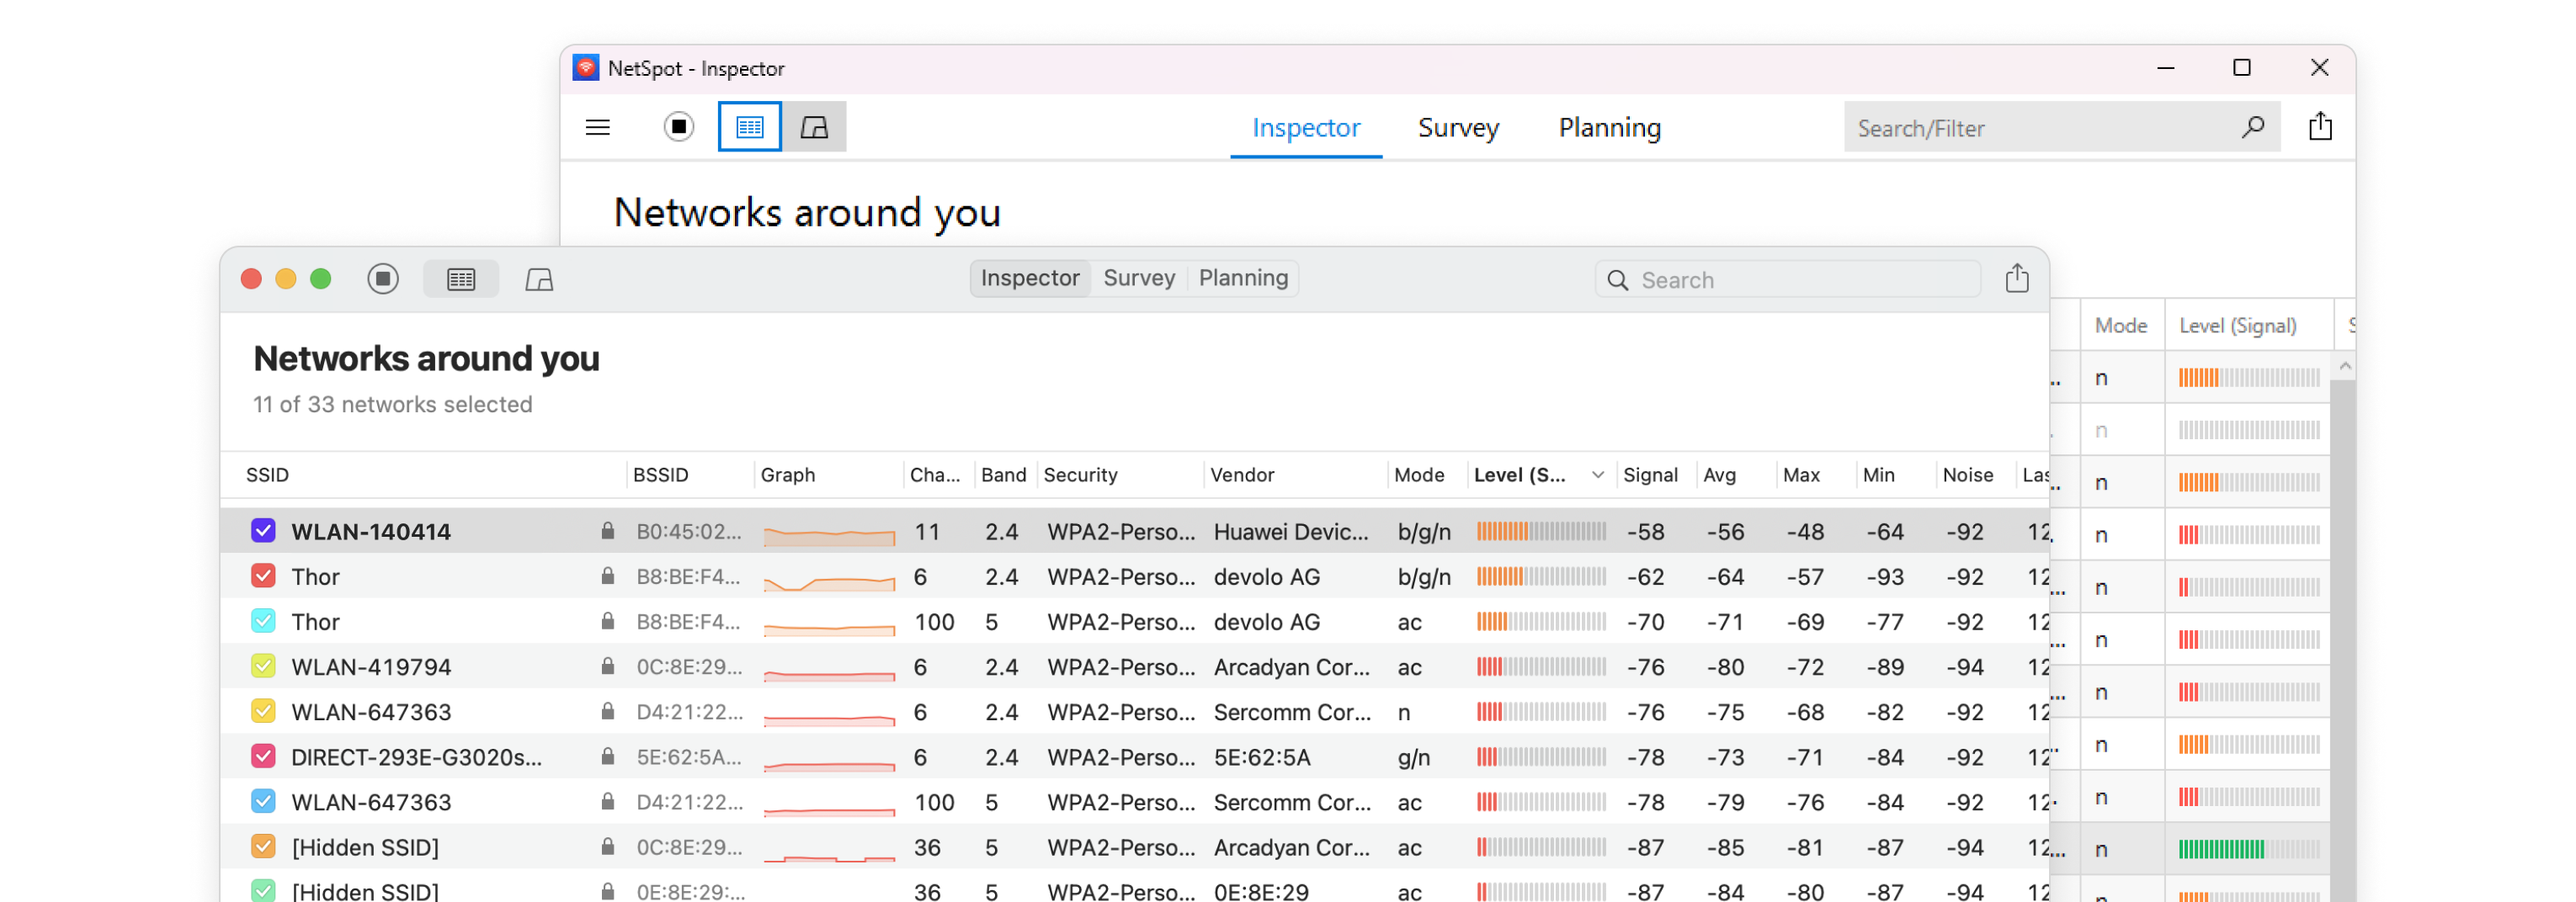
Collect live Wi-Fi data from all surrounding networks and quickly analyze them with the help of color-coded dBm data markers.
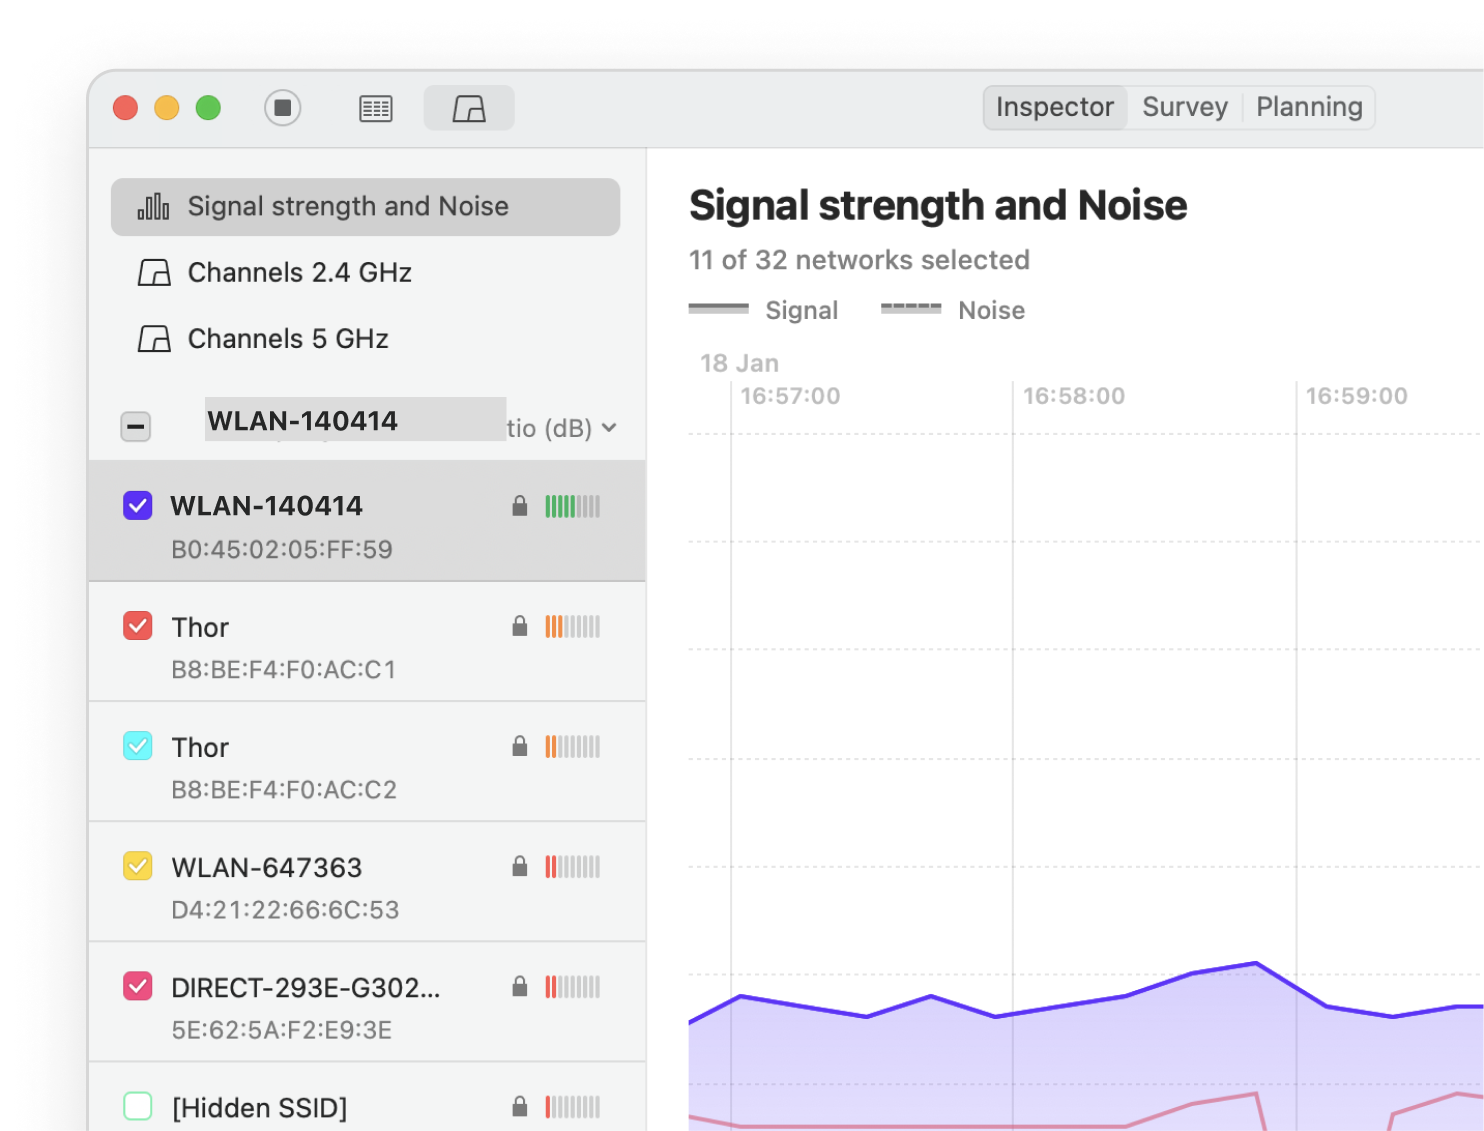
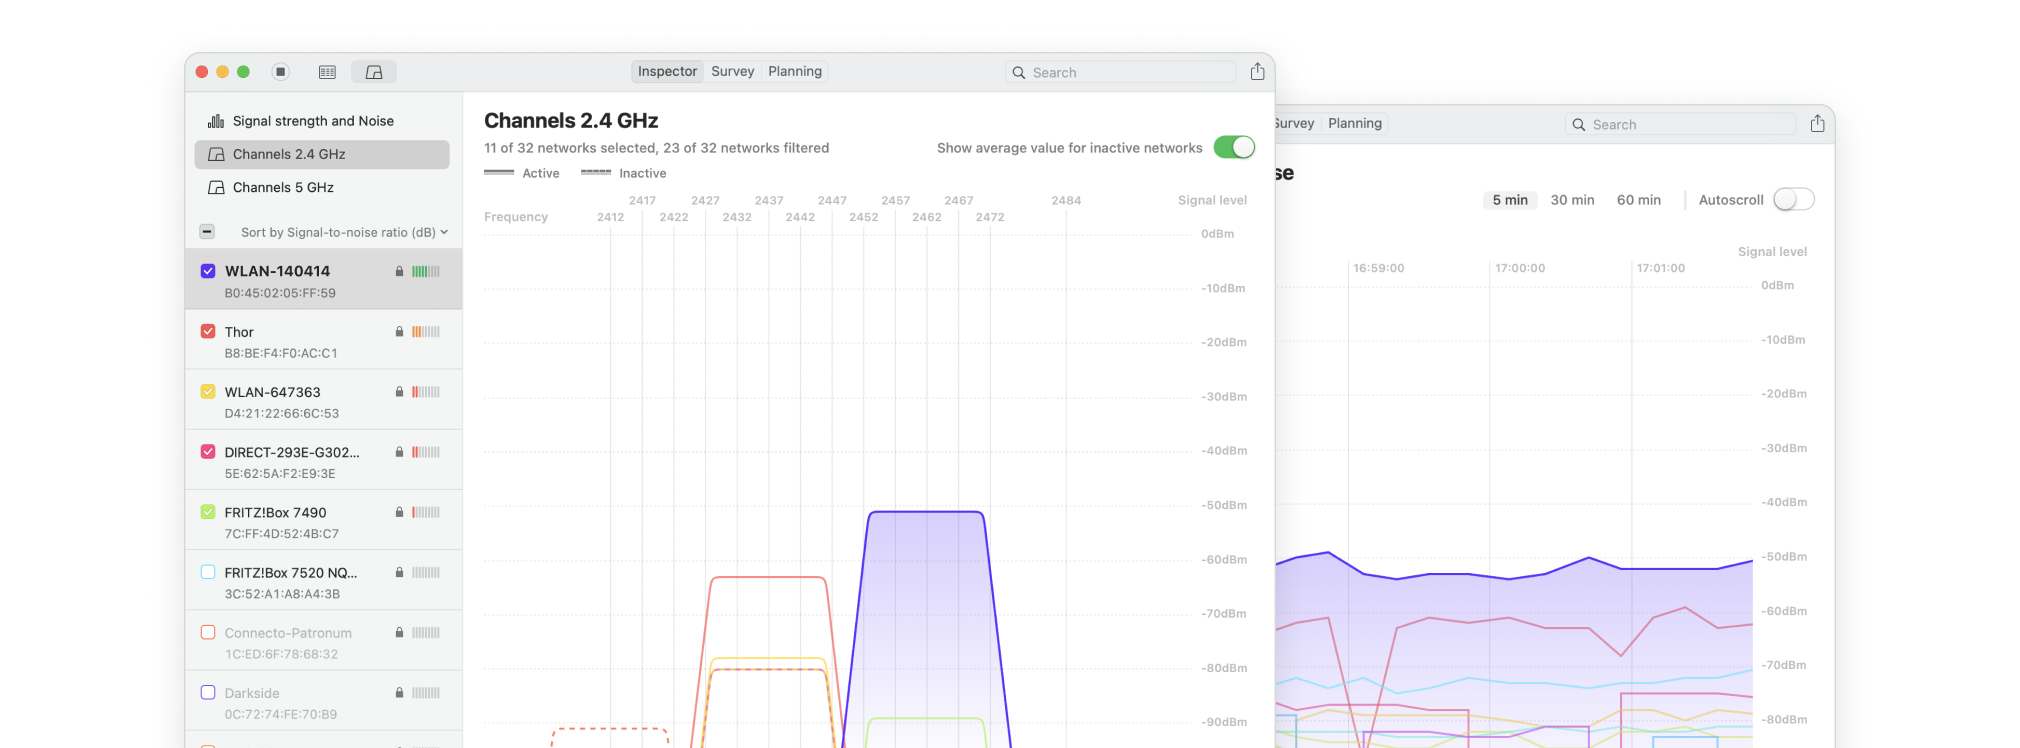
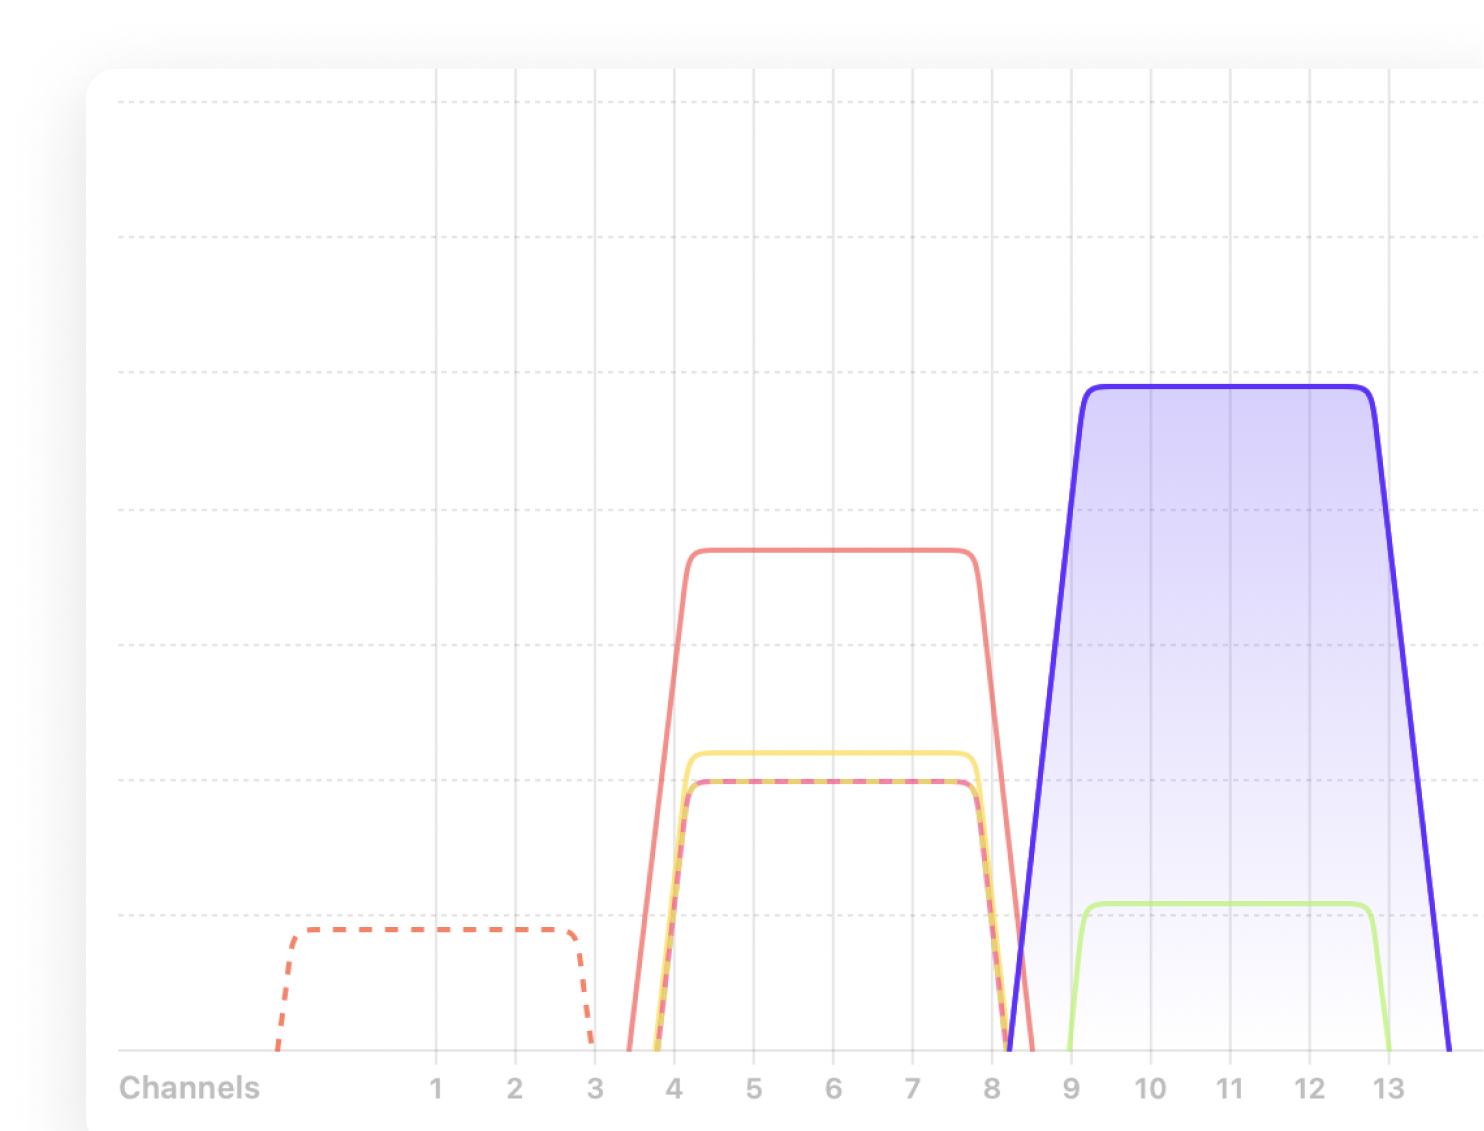
Easy navigation between comparison graphs. Customizable signal level and noise charts display changes in real time. Locate your busiest and least occupied channels.
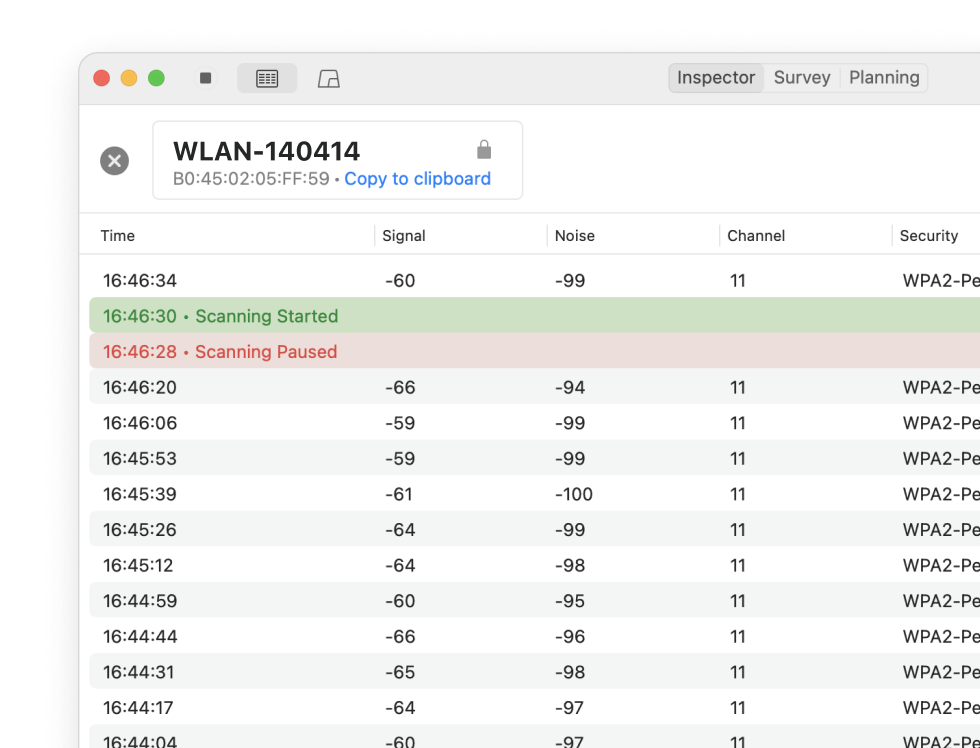
See channel info, transmit rate, vendor, security type, band and even more details about the APs available on the network.
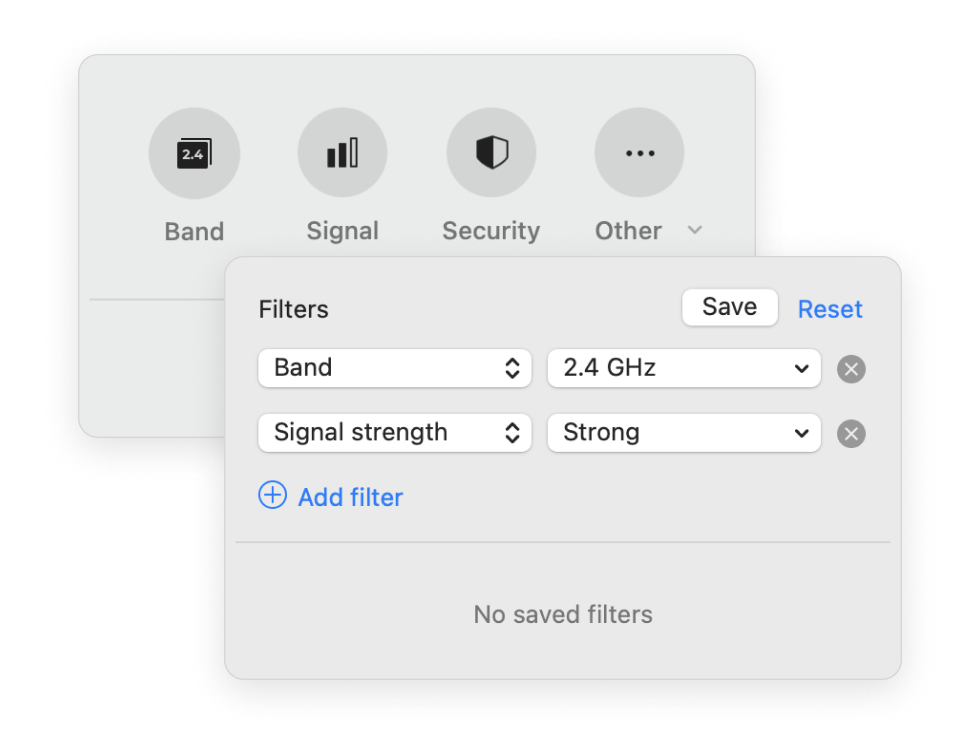
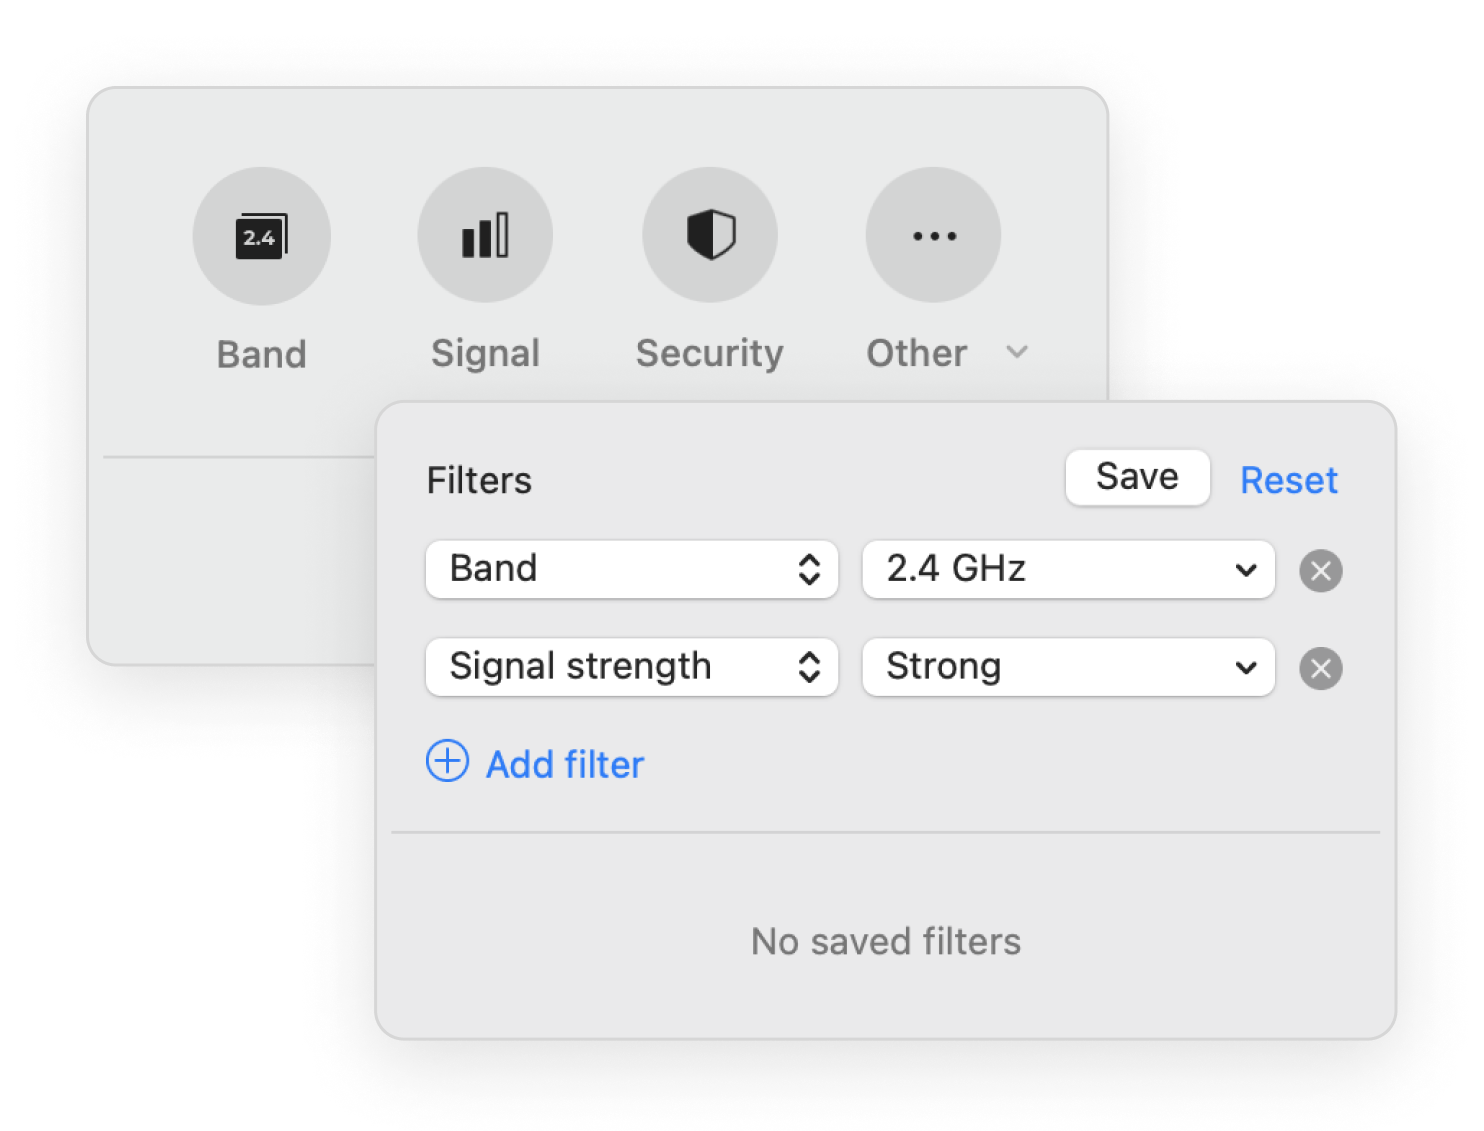
Find the needed network from many APs around you fast. Efficient filters allow you to quickly find networks with specified parameters.
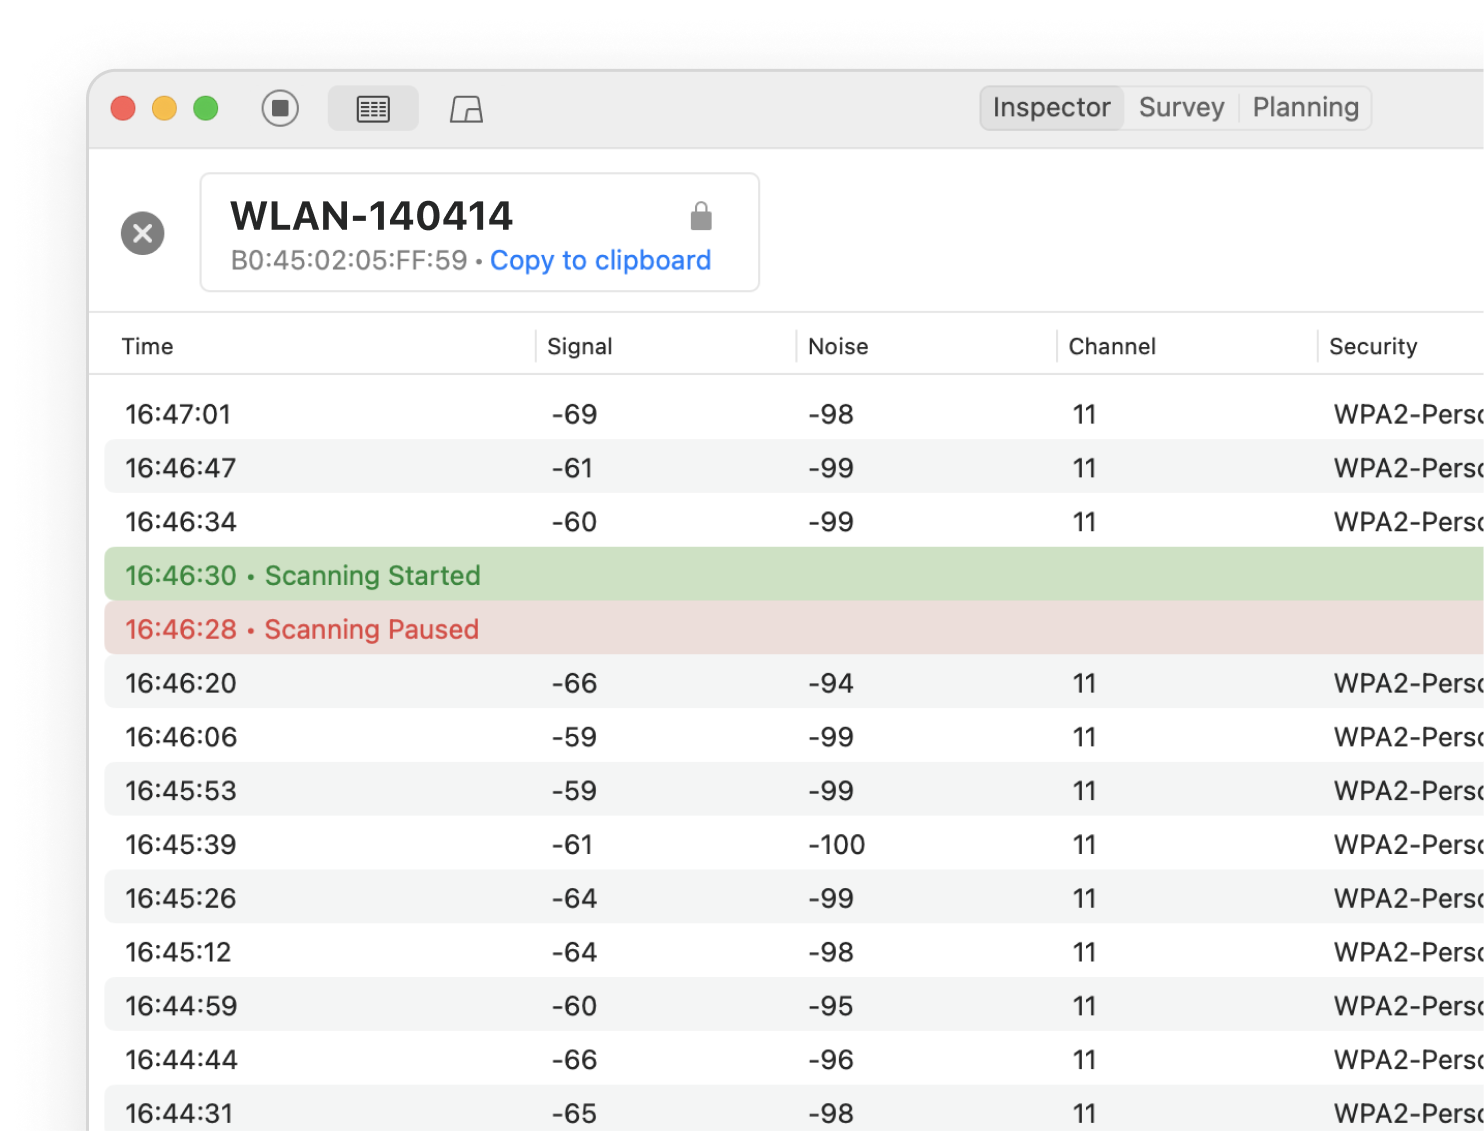
Inspector mode is ideal to locate Wi-Fi issues in a specific area. Save historical data per each AP for later review.
Get all the network information you need for the most optimal wireless router setup.
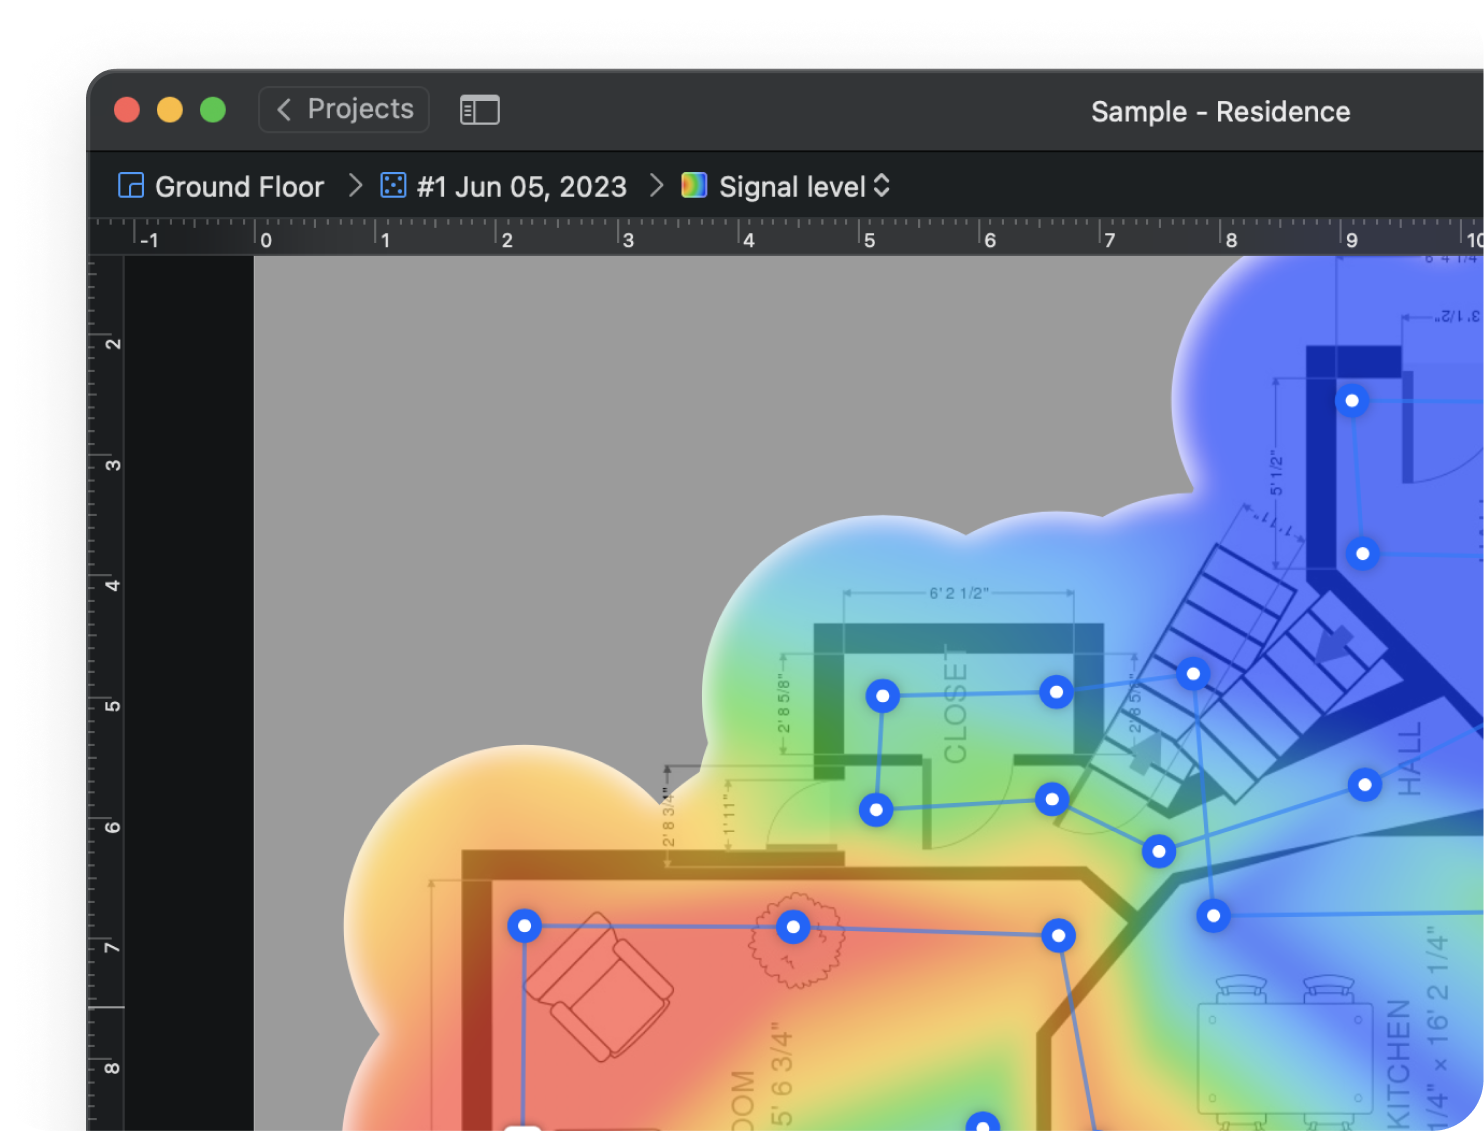
With NetSpot, the in-depth network analysis is a breeze, thanks to its interactive color-coded heatmaps. Outline your real-life Wi-Fi data on a map quickly and easily. Flexible professional reports included.
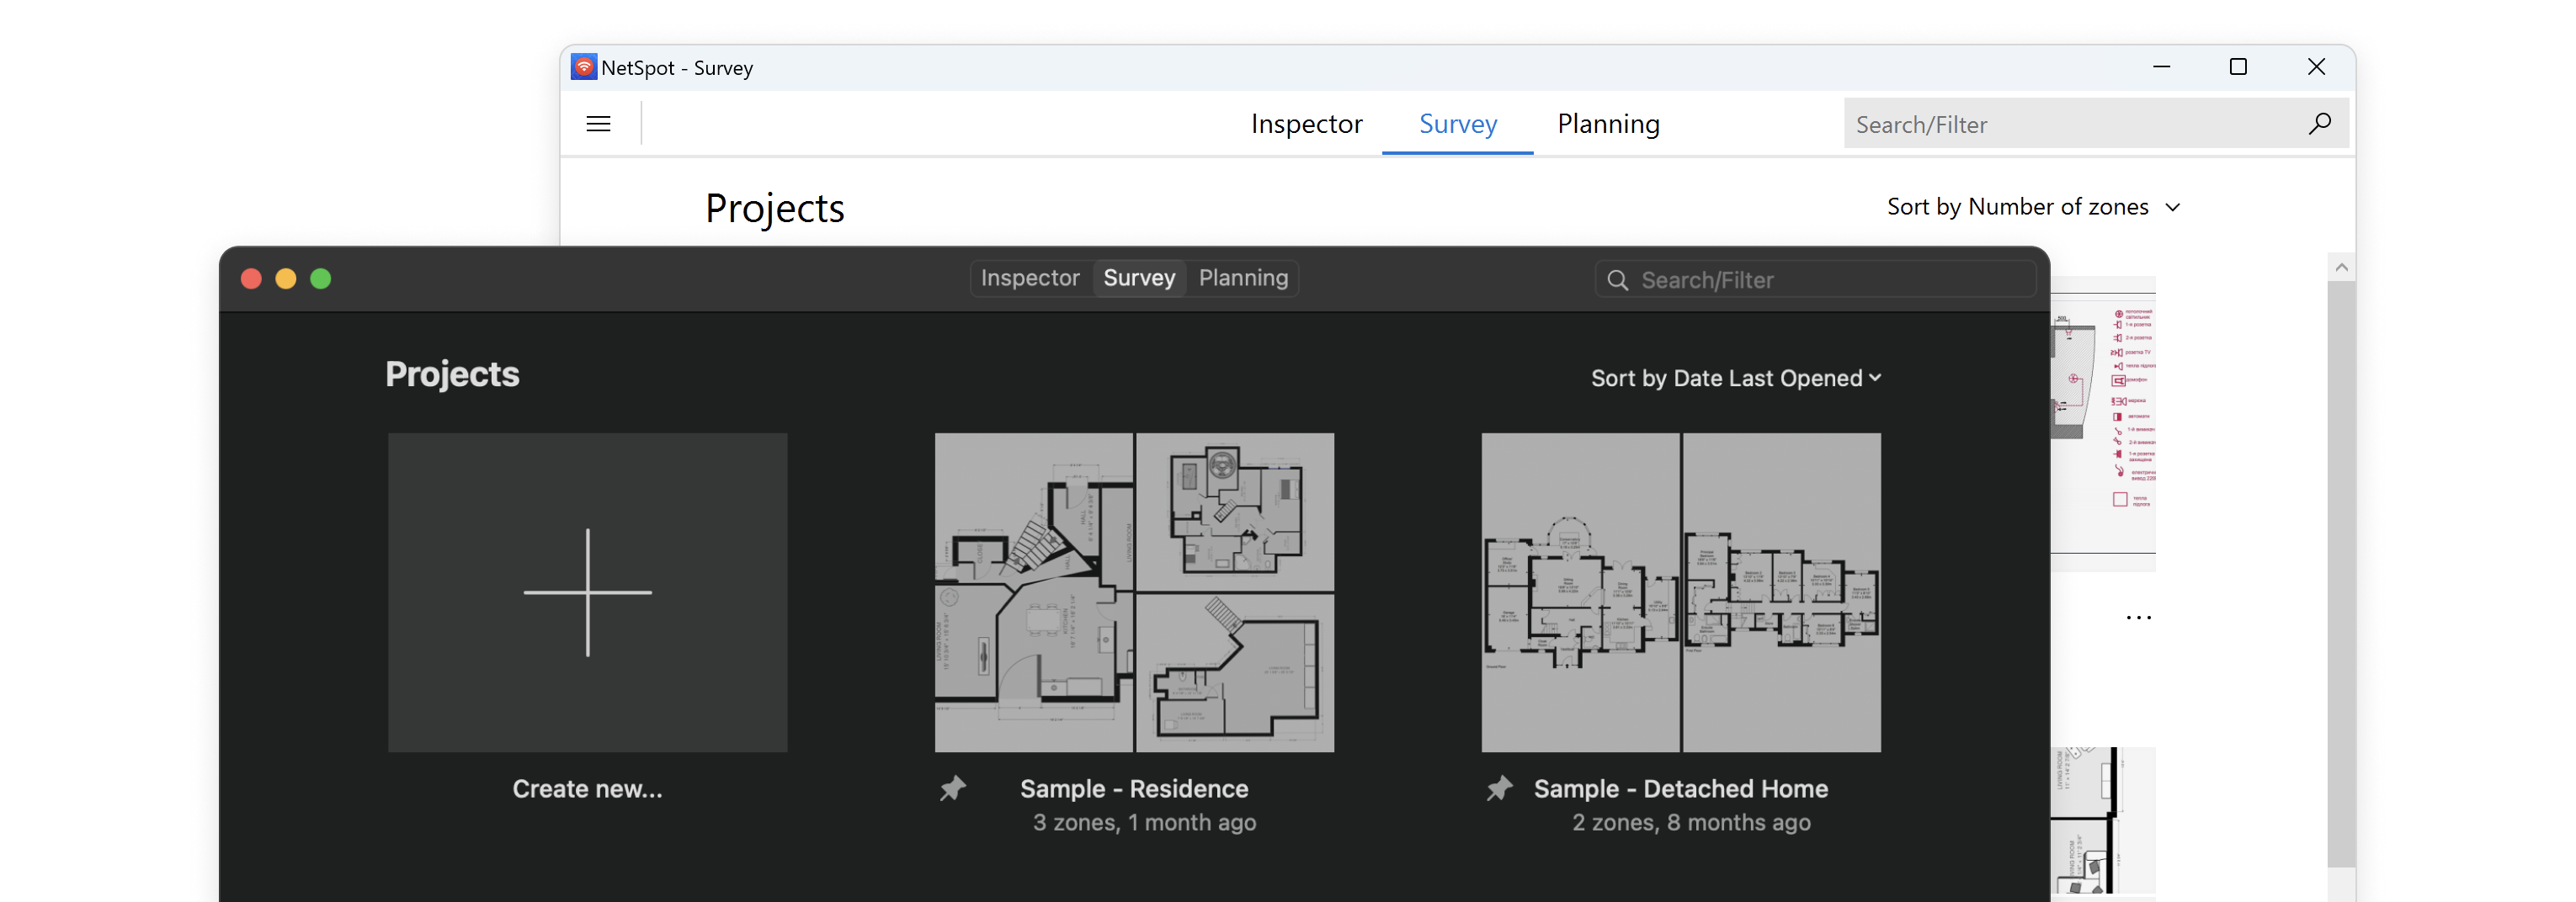
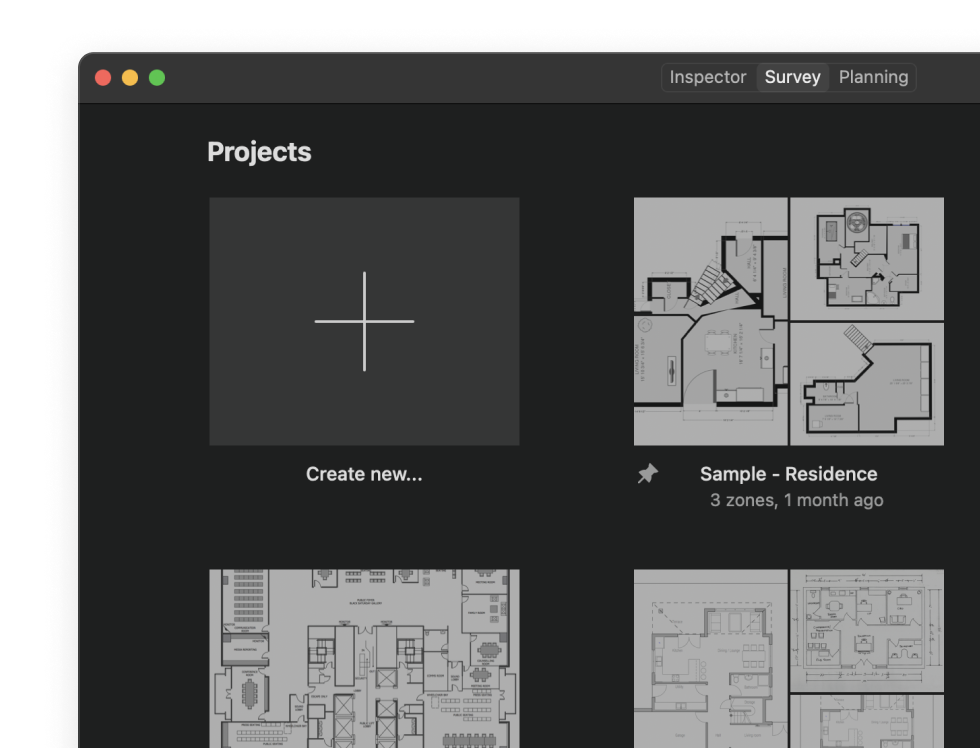
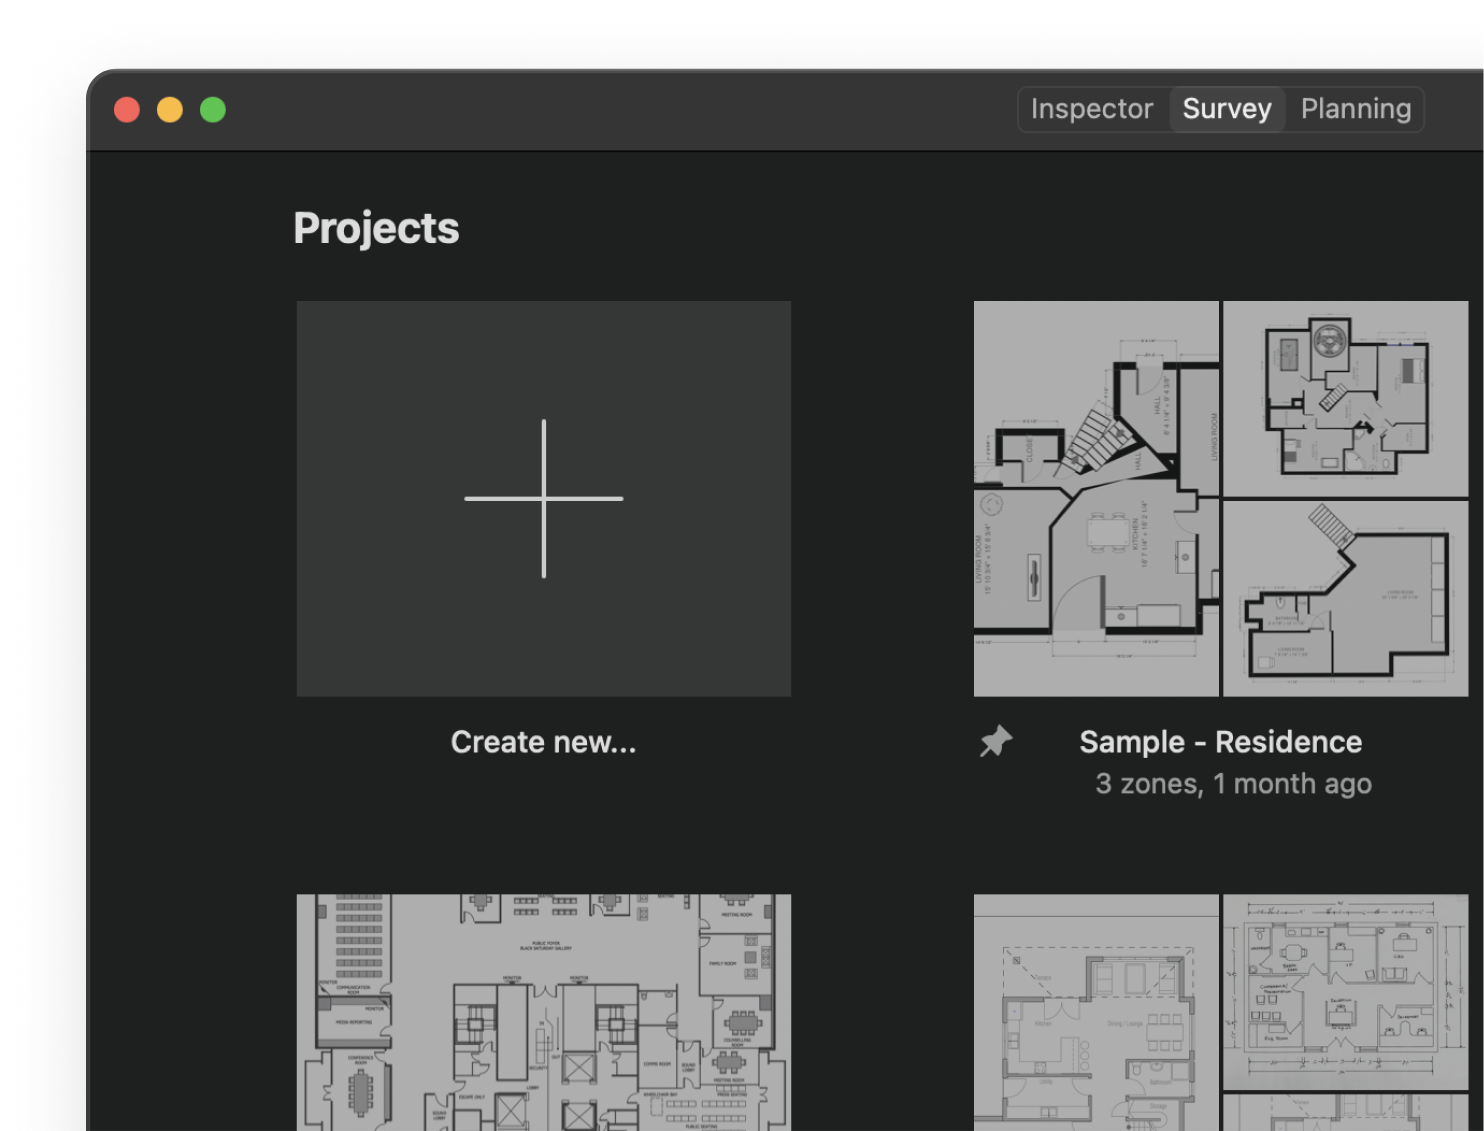
Your projects are comprehensively laid out with their snapshots. Access them quickly through NetSpot's Open Recent menu, use sorting and filtering to find any project quickly.
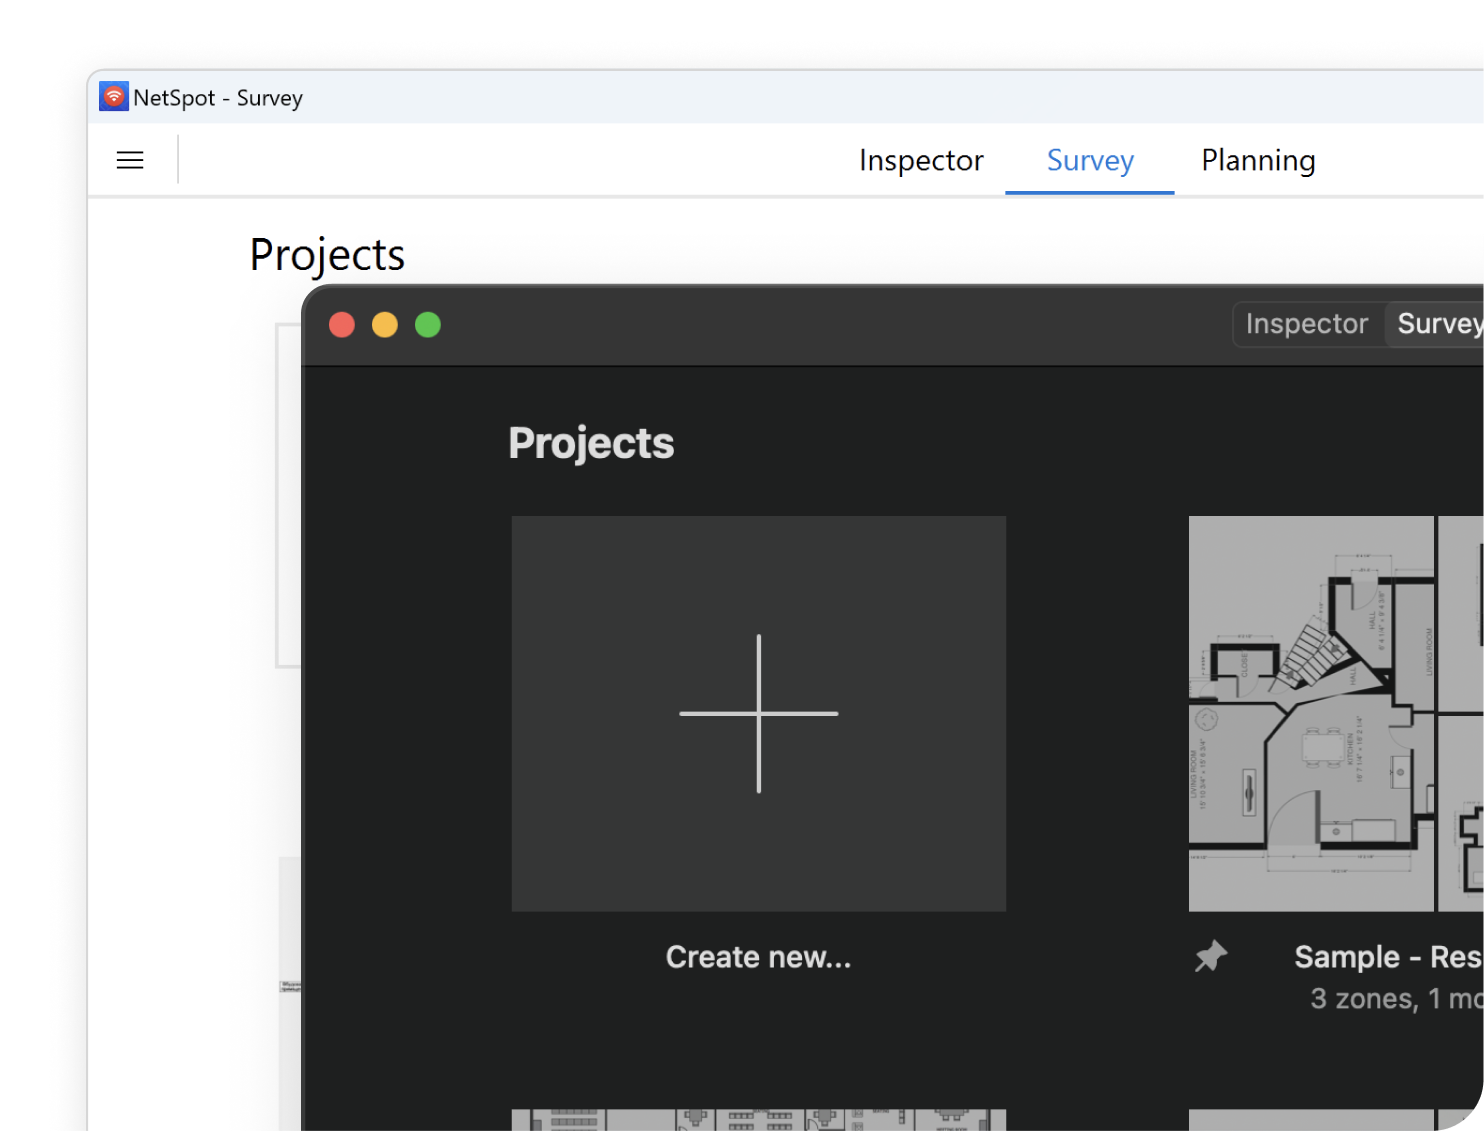
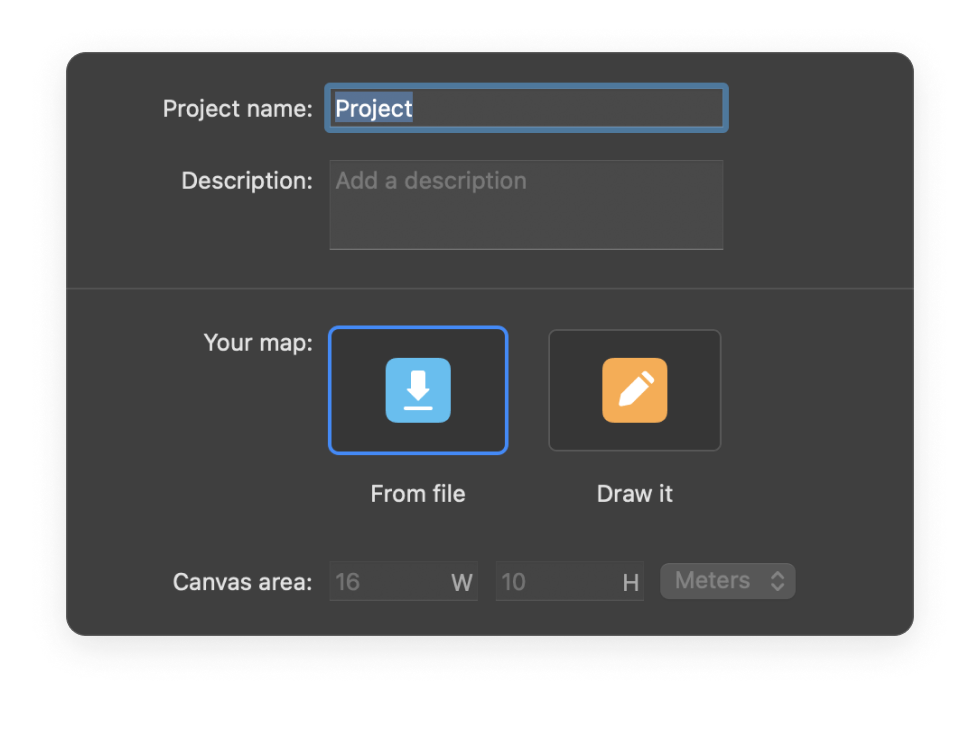
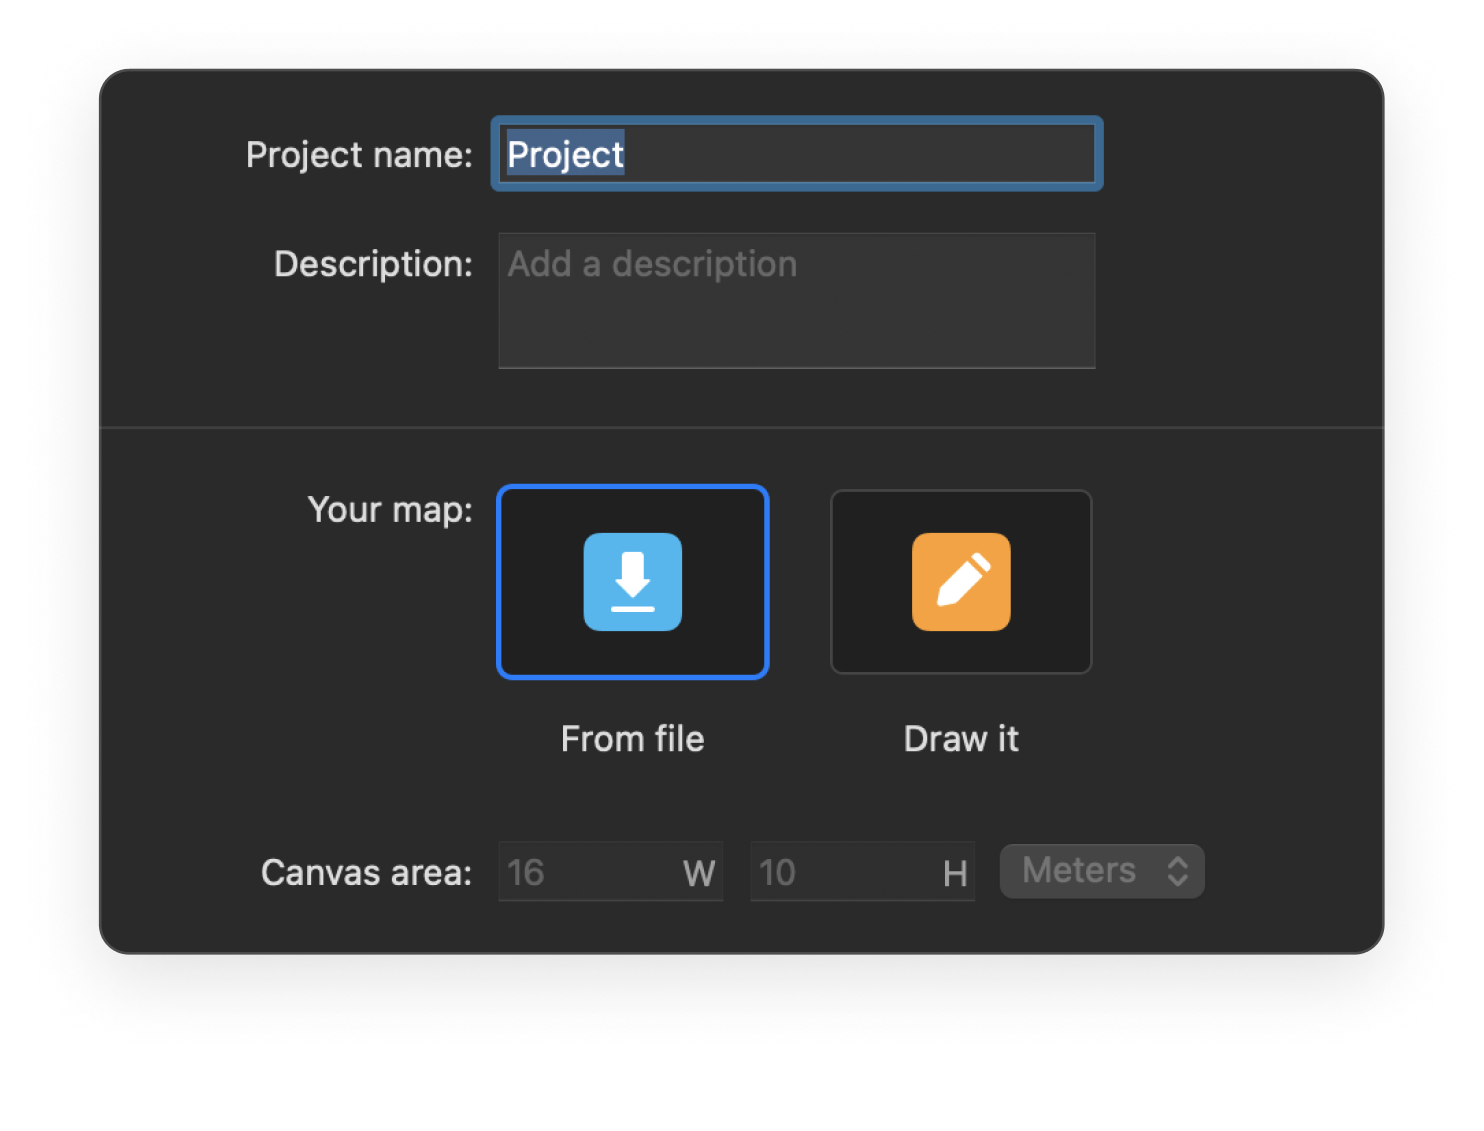
New project creation is a breeze thanks to an enhanced and optimized wizard.
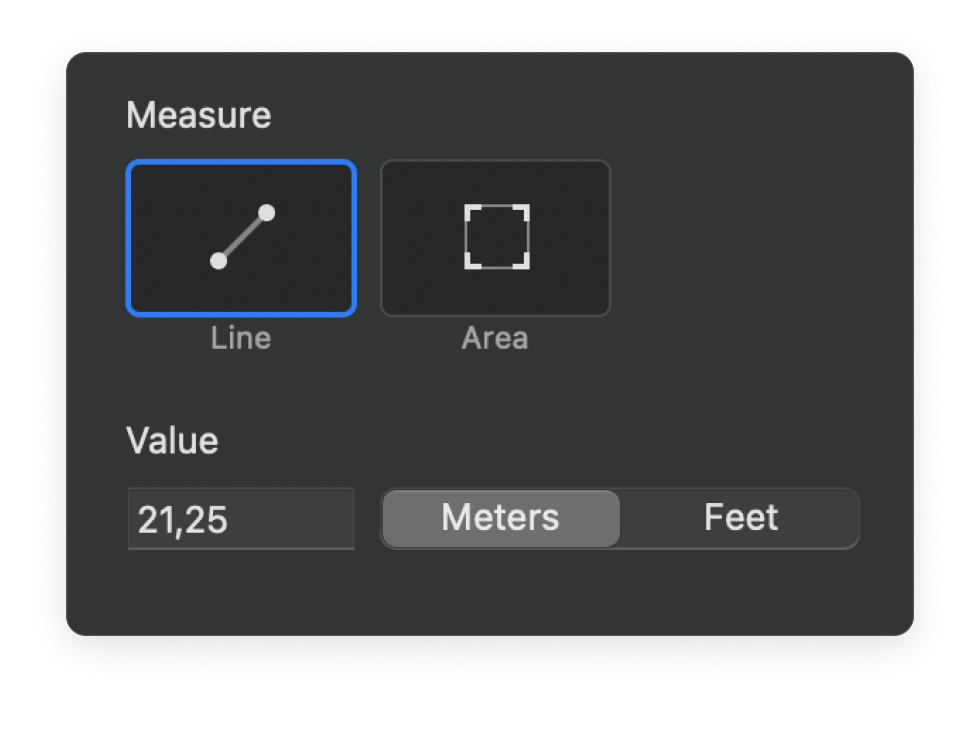
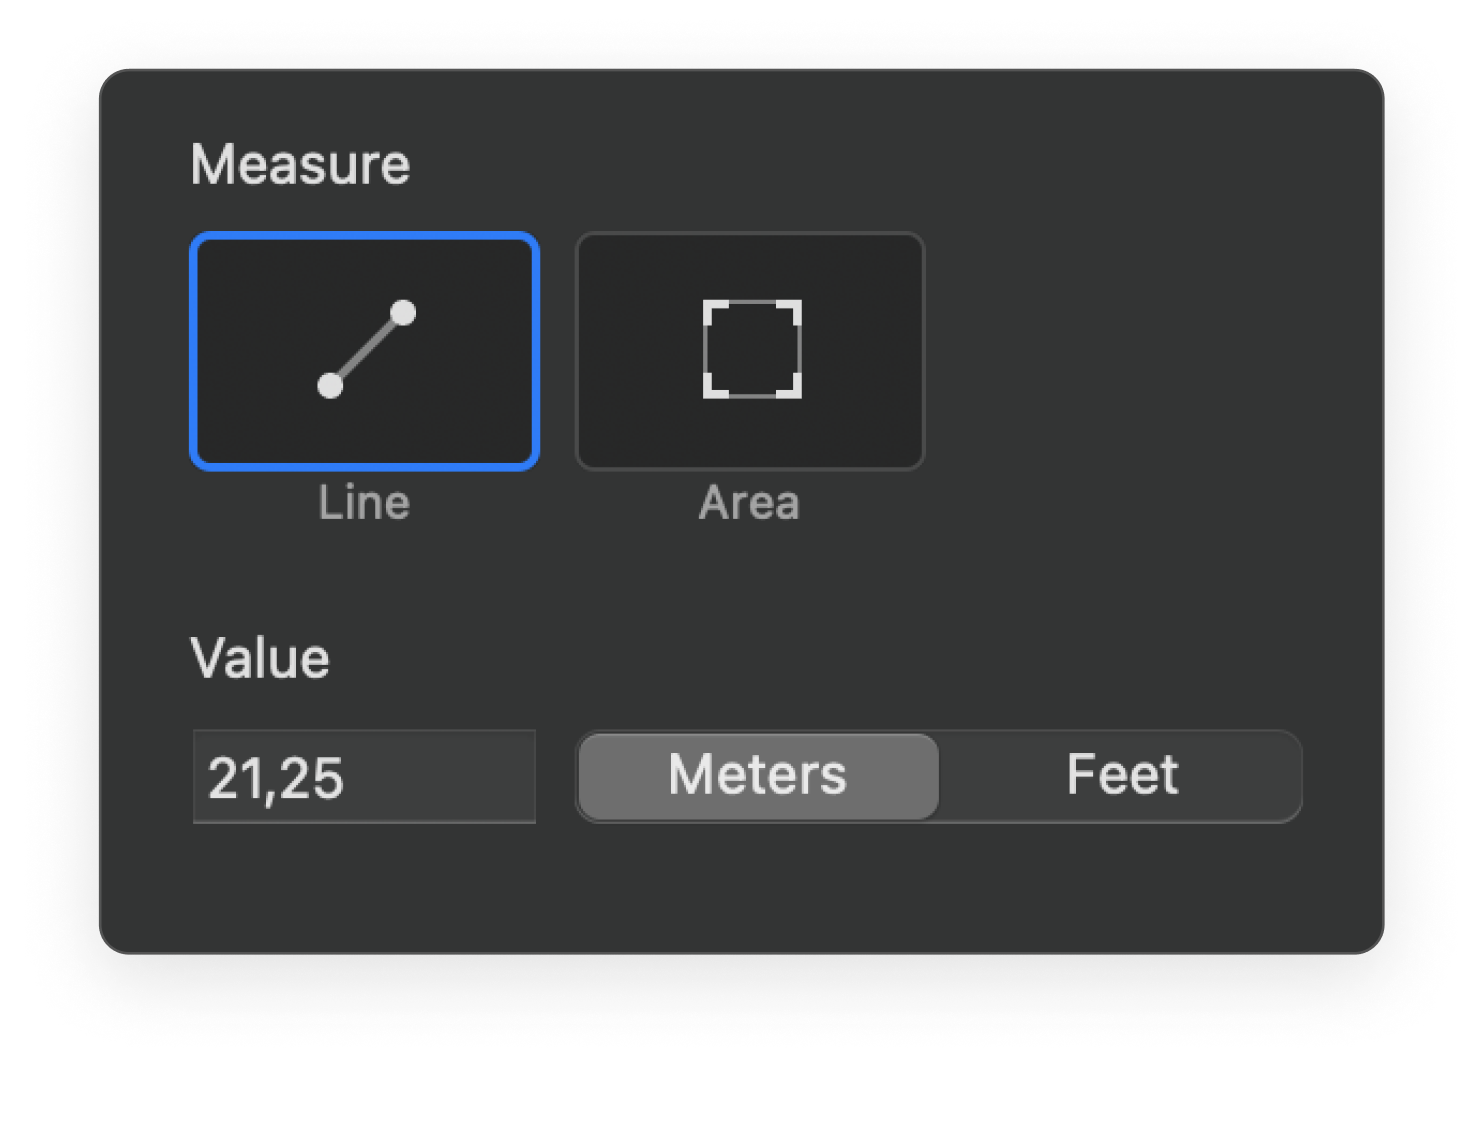
Calibration mechanisms provide more precision for your survey projects and visualizations.
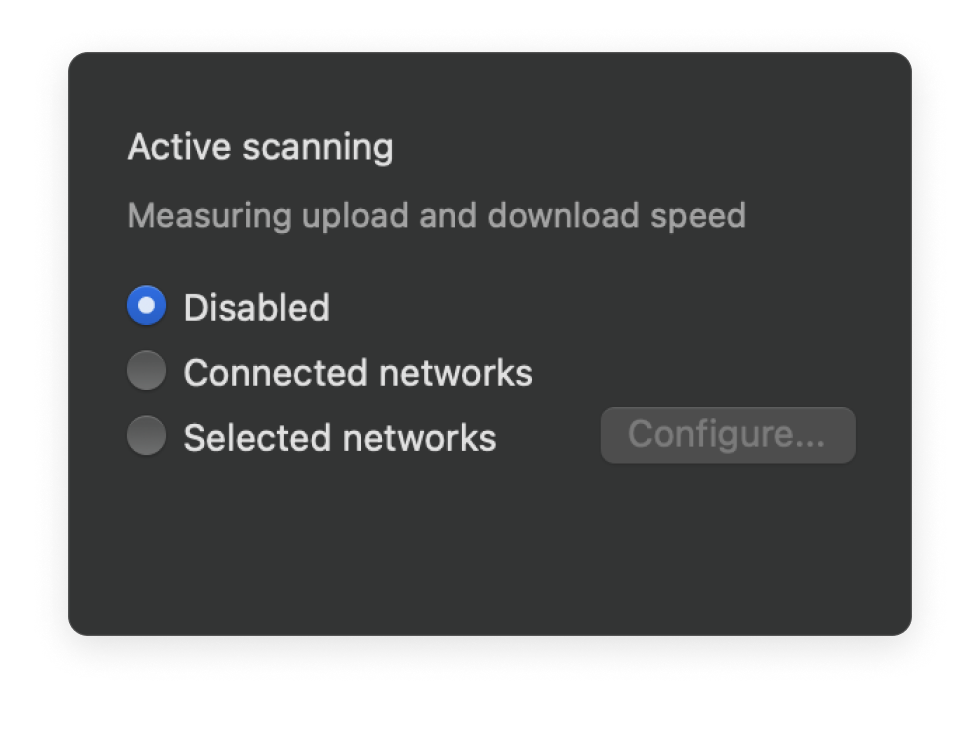
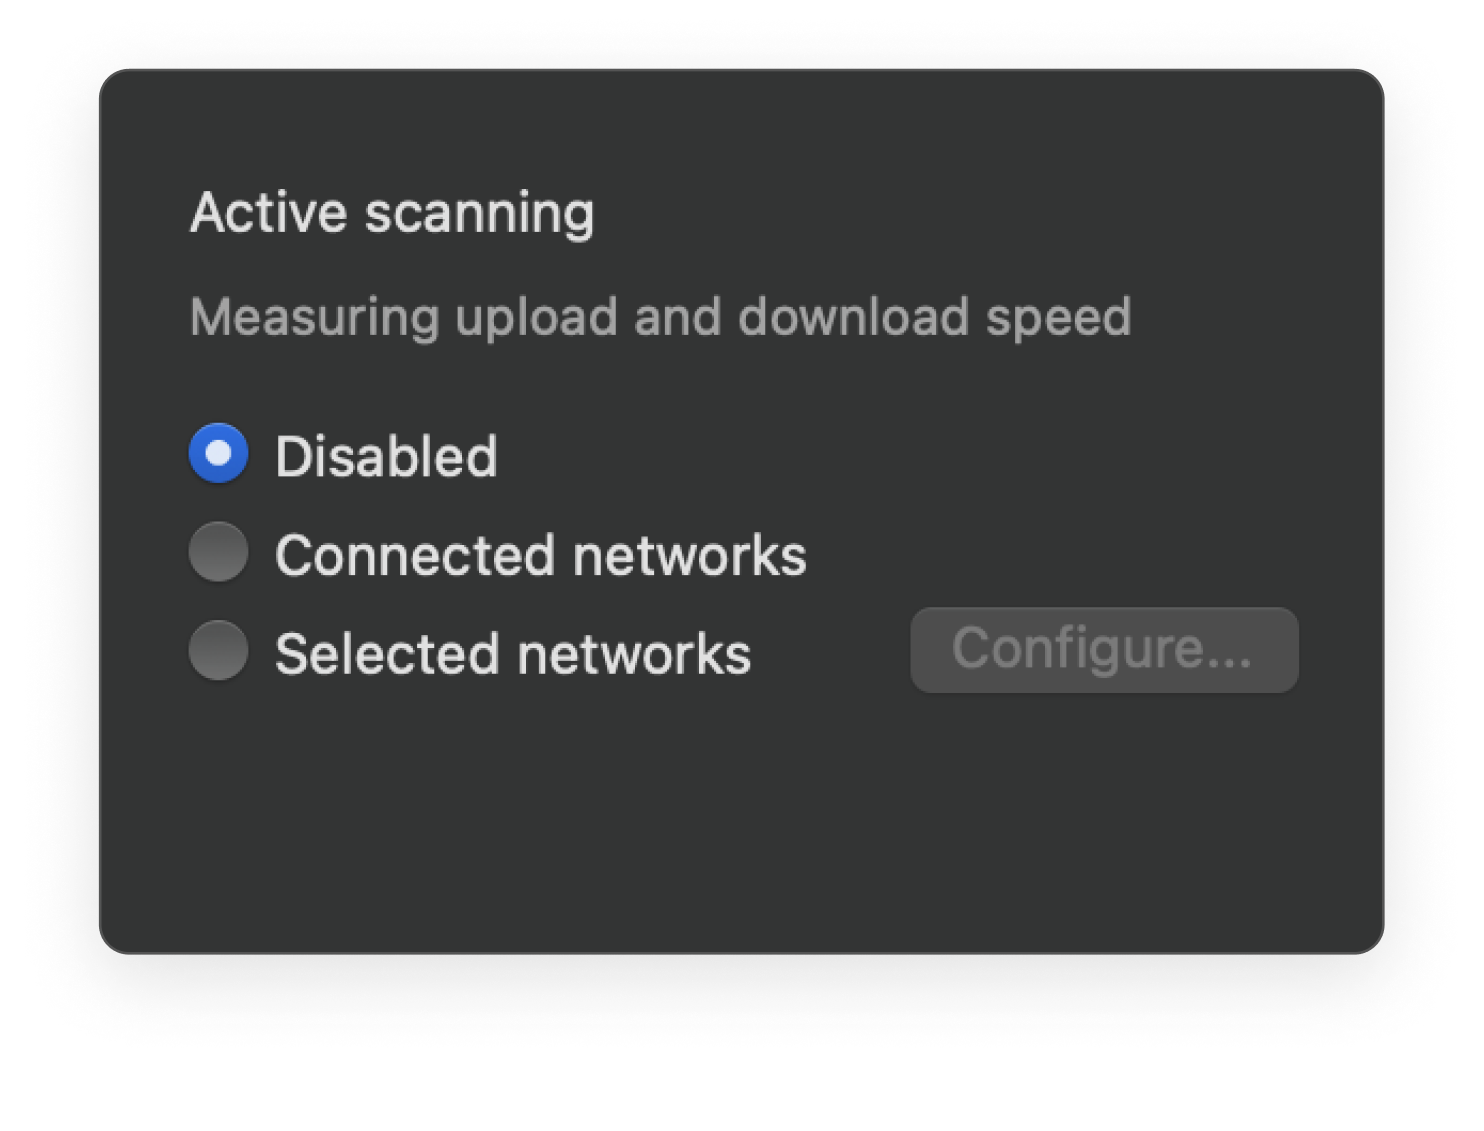
Use the Active Scan feature to measure your network's Internet connection speed for the most exhaustive survey report.
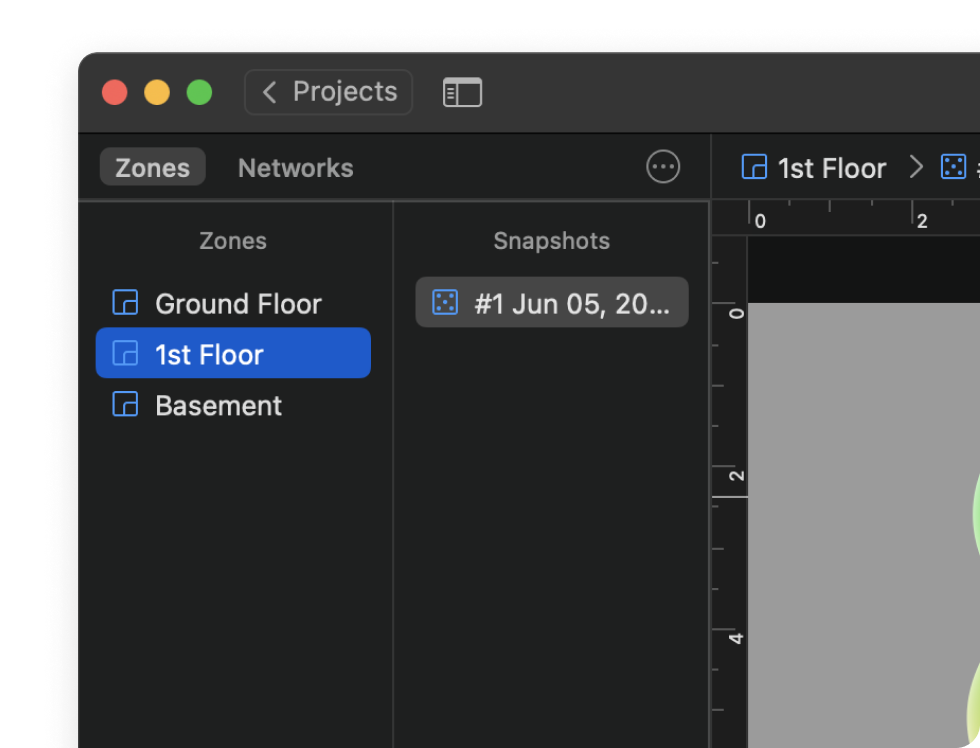
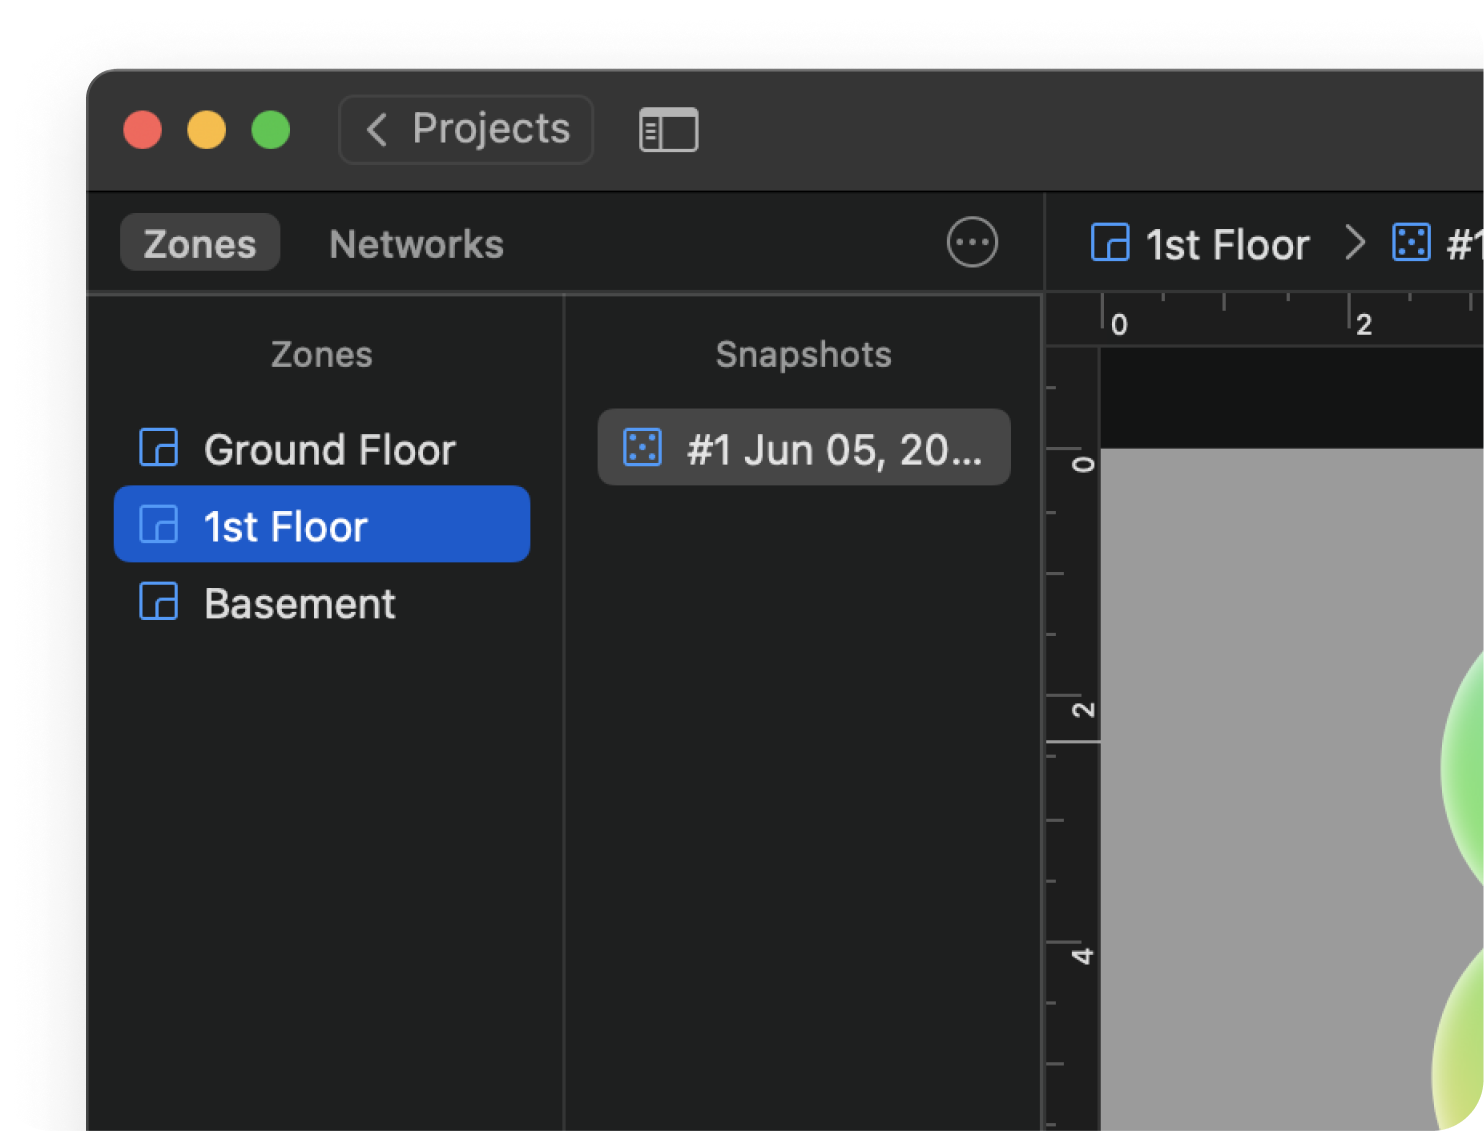
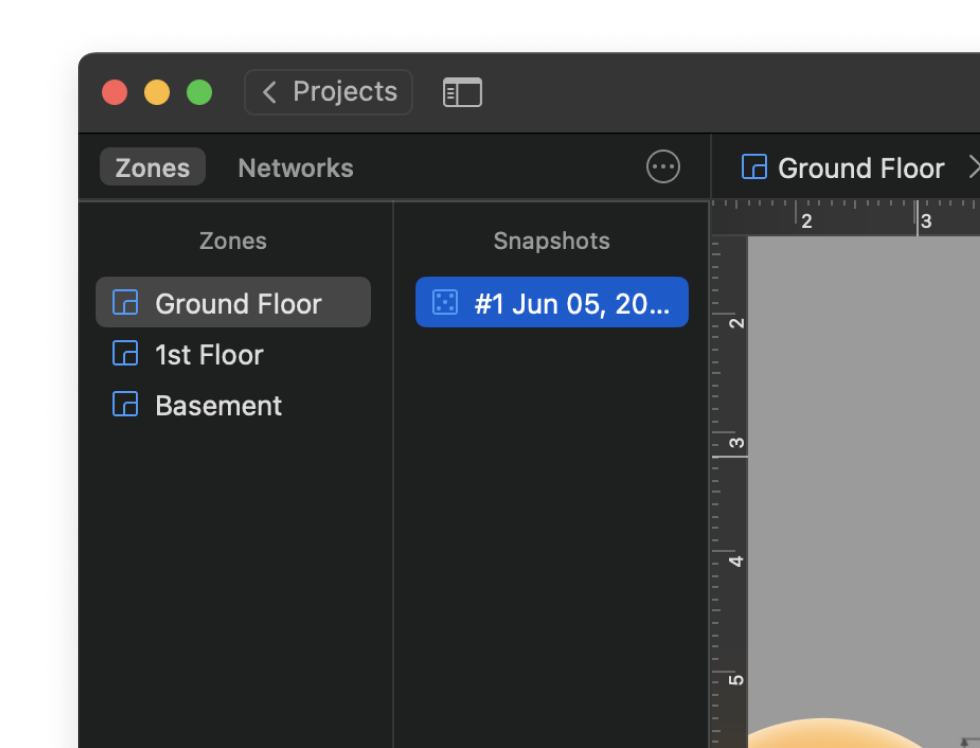
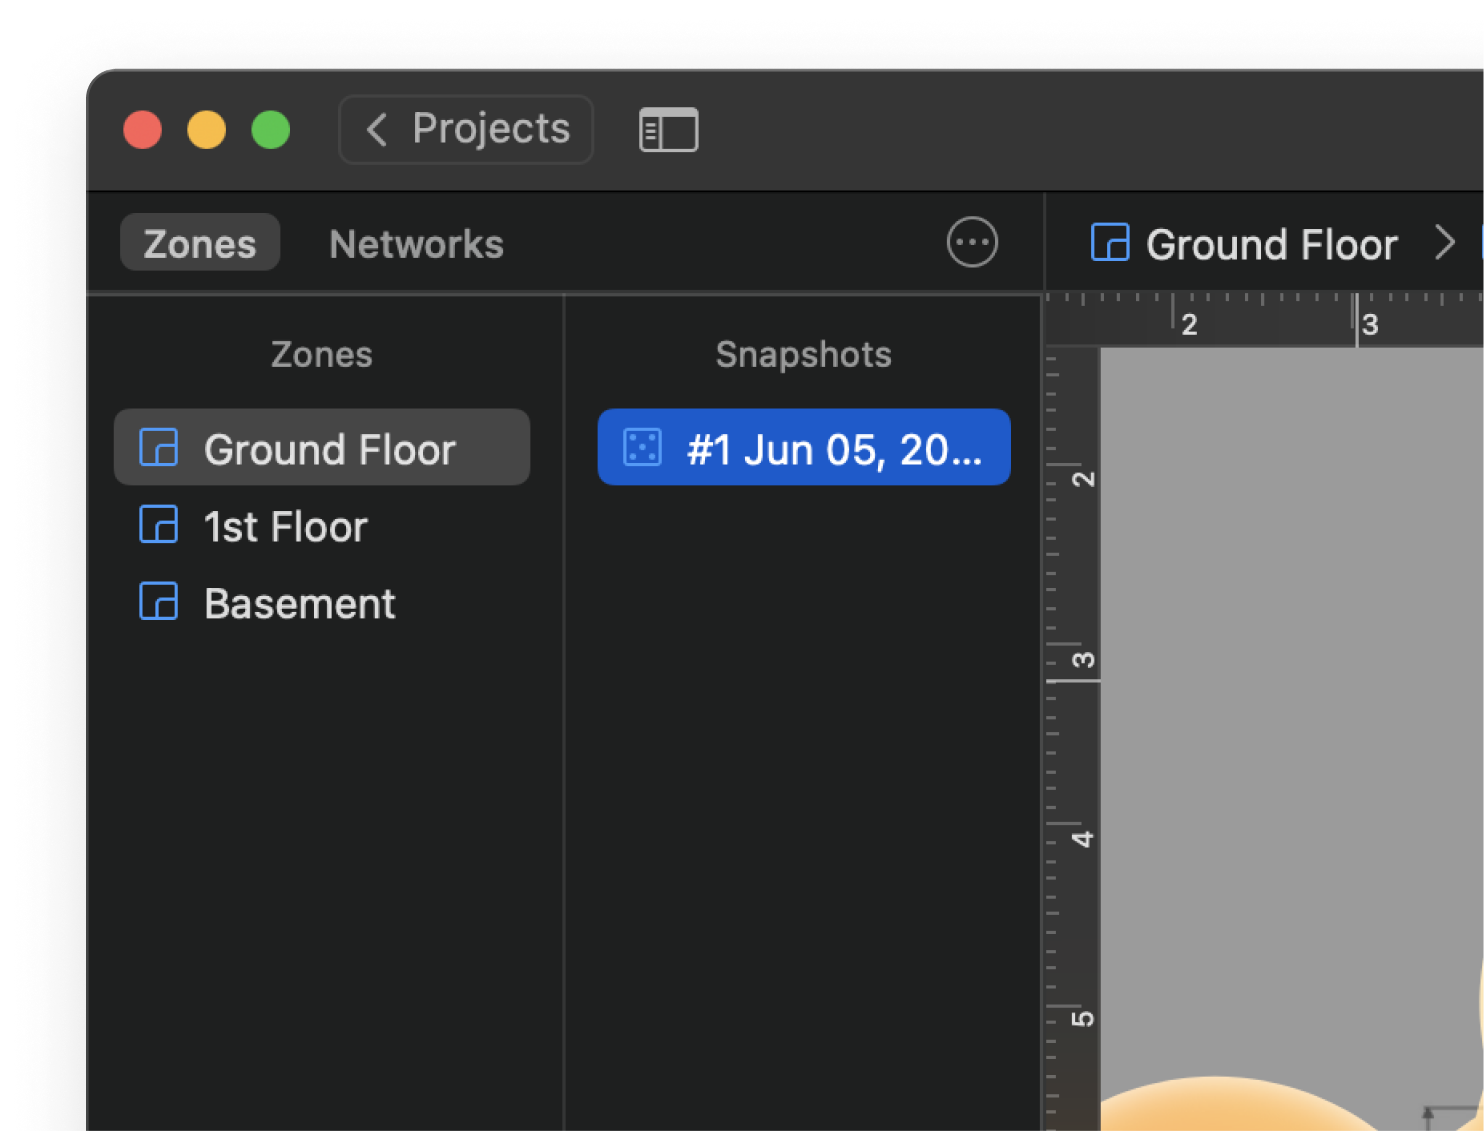
Create multiple zones per project to represent different areas, floors, levels, etc.
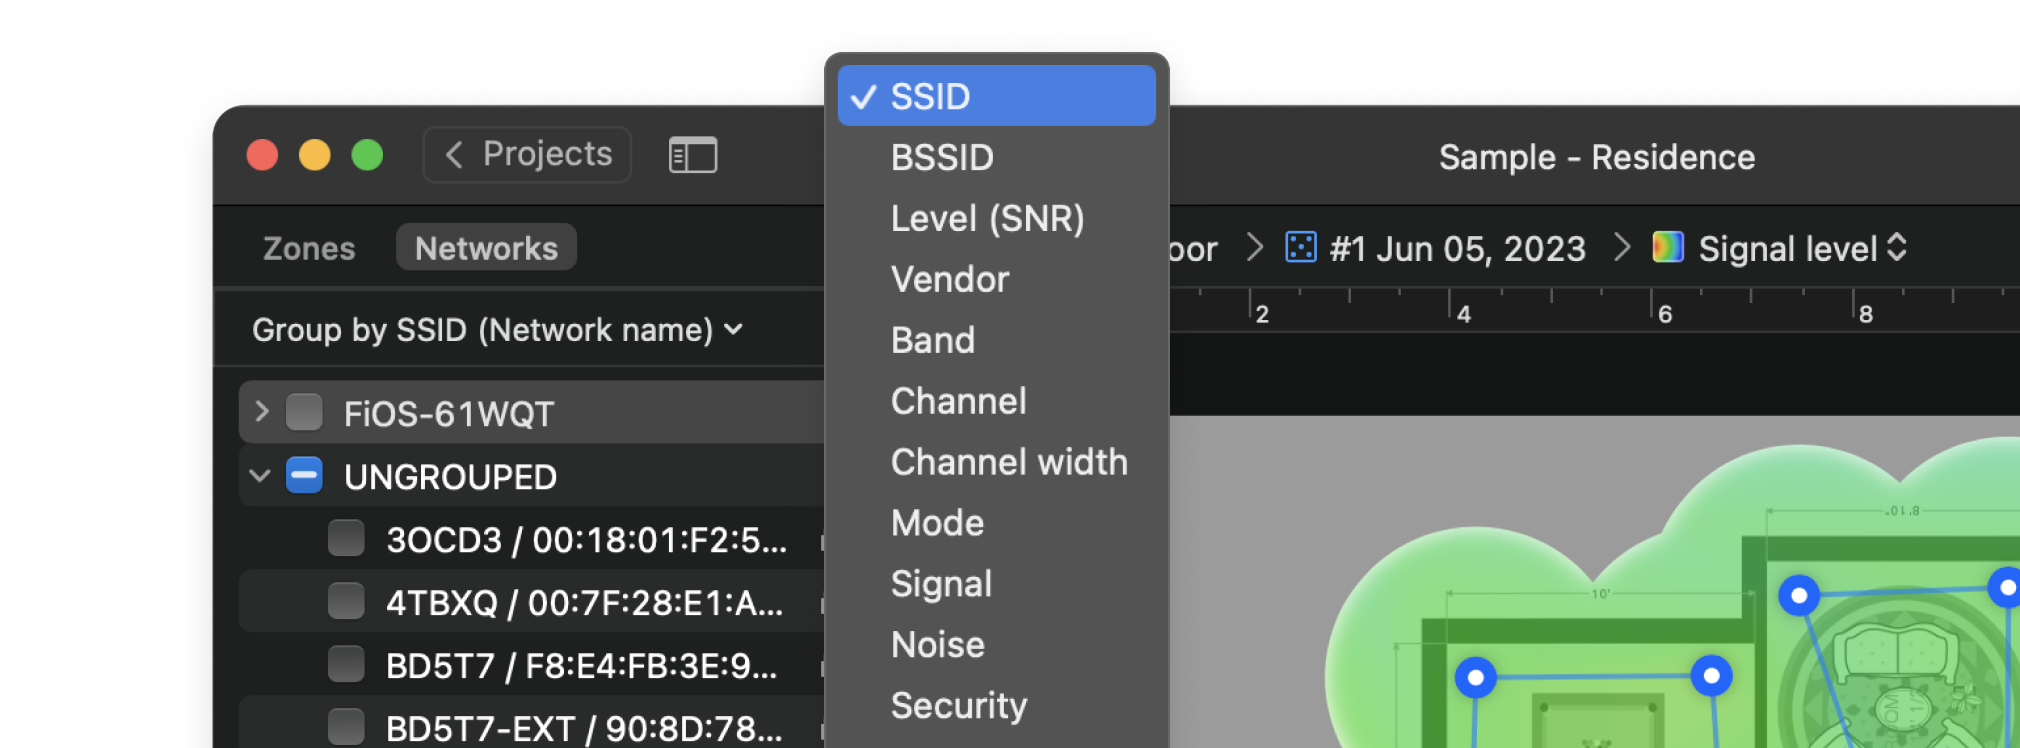
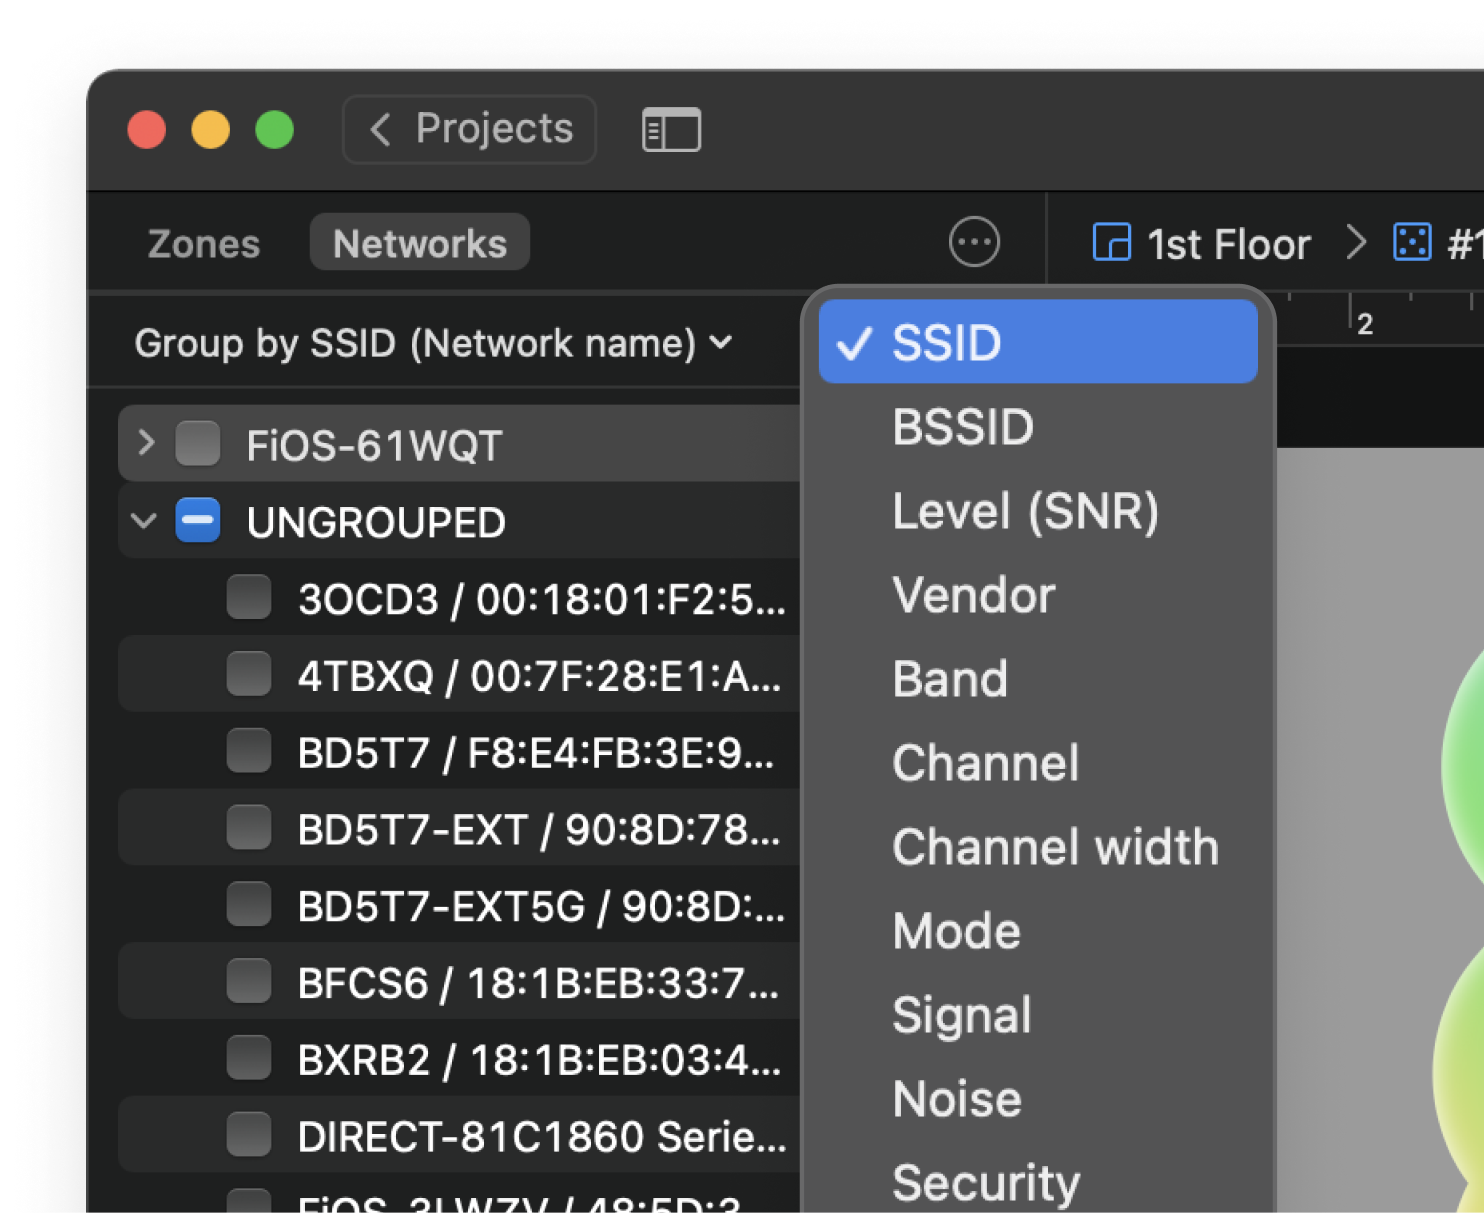
Conveniently manage networks by grouping them according to various parameters, e.g. rooms or floors of the office building.
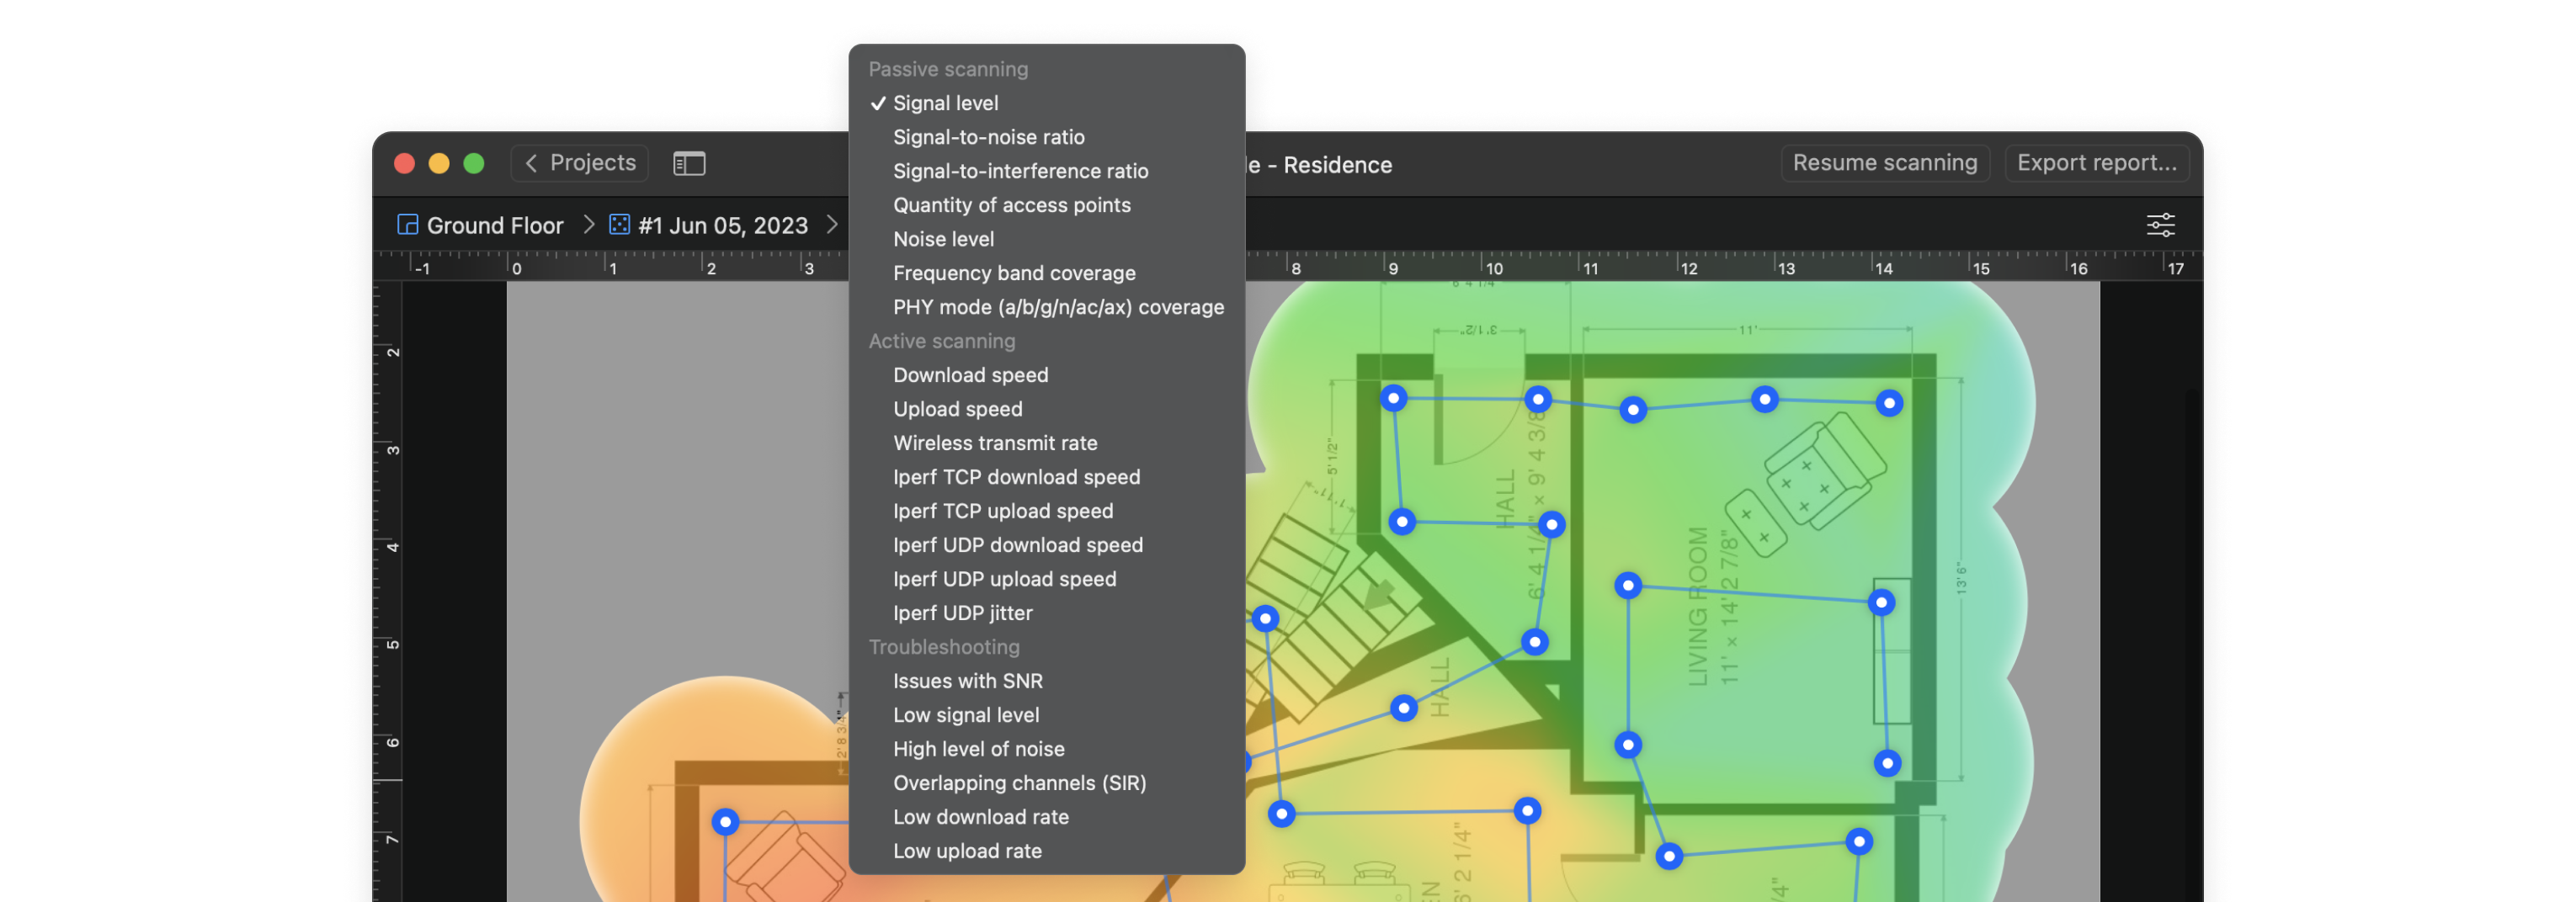
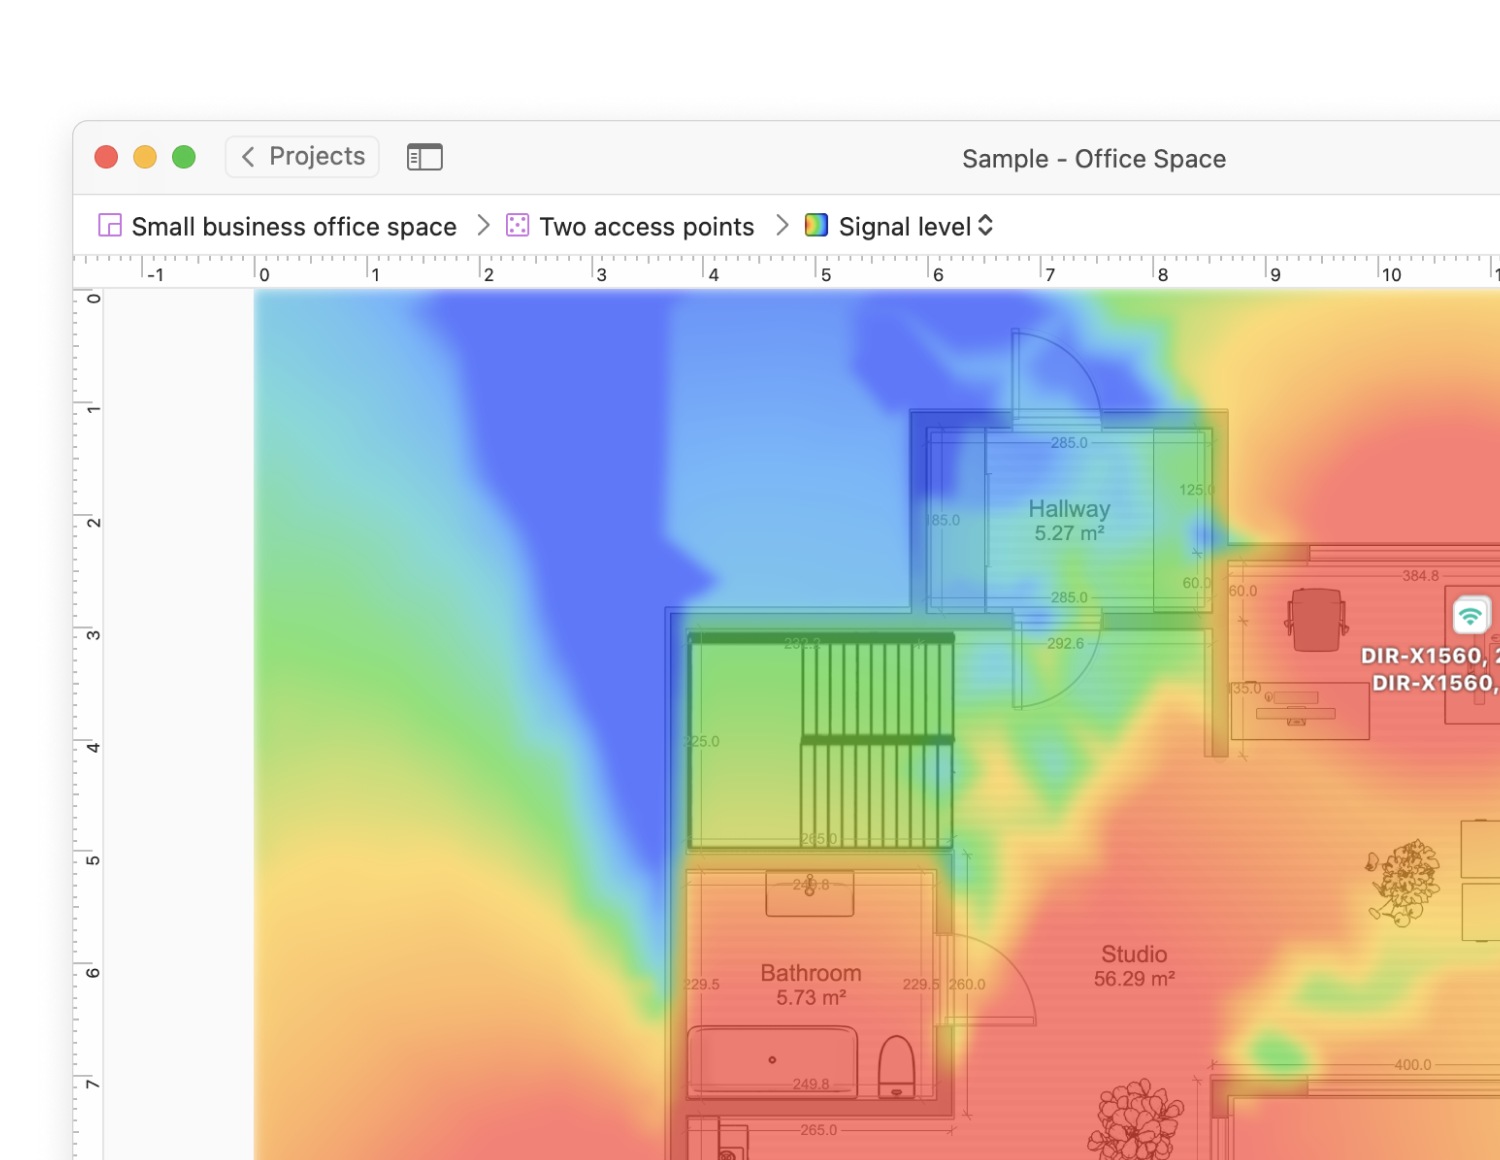
Interactive heatmaps with detailed information on all surveyed wireless networks in every point of the map. NetSpot offers more than 20 heatmap visualizations that help troubleshoot and manage any Wi-Fi setup. By helping analyze every access point, NetSpot can scale up from useful-to-everyone to incredibly detailed for the true wireless networking mavens.
It compares the level of WiFi signal to the background noise level, the latter being the amount of outside interference determined at each measuring point.
In signal-to-interference ratio the latter is specific to co-channel interference from other radio transmitters.
Shows the second strongest Wi-Fi signal strength (measured as RSSI) detected at a specific measuring point. By analyzing this signal level, you can see how the secondary signal covers your space, where the clients may have inefficient switch between the APs, and experience degraded WiFi performance.
Shows the amount of outside interference measured at each point.
It allows quick visual analysis on different frequencies.
It displays the strength of your WiFi signal, which is important in combination with other values showing how signal level corresponds to interference level for example.
NetSpot always shows you the number of currently detectable access points on your network.
It builds visualization by WiFi protocols/modes and shows where 802.11a/b/g/n/ac/ax/be mode is used.
This speed reflects the rate of data transfer from the user's computer to the Internet.
This speed reflects the rate of data transfer from the Internet to the user's computer.
Shows the speed of data transfer from an AP to a wireless device.
As well as throughput testing with Iperf 3 or custom speed test servers, they help test the bandwidth performance.
For troubleshooting purposes use the Issues with SNR visualization, which will help you determine the spots with the low SNR level that can affect your network connectivity.
High noise levels can affect the signal strength of your network and create areas of poor connectivity or no connectivity at all — “dead zones”.
Seeing visually where the low signal level is helps you fix issues with poor to no connection with certain access points.
NetSpot will show you where there are overlapping channels, and the signal level is low, as well as low download and upload rates.
This heatmap allows you to visually assess the areas with a low secondary wireless signal. Based on the results you will be able to see what adjustments you could make in order to improve your secondary wireless setup.
Create any number of snapshots within each zone to quickly compare Wi-Fi configurations.
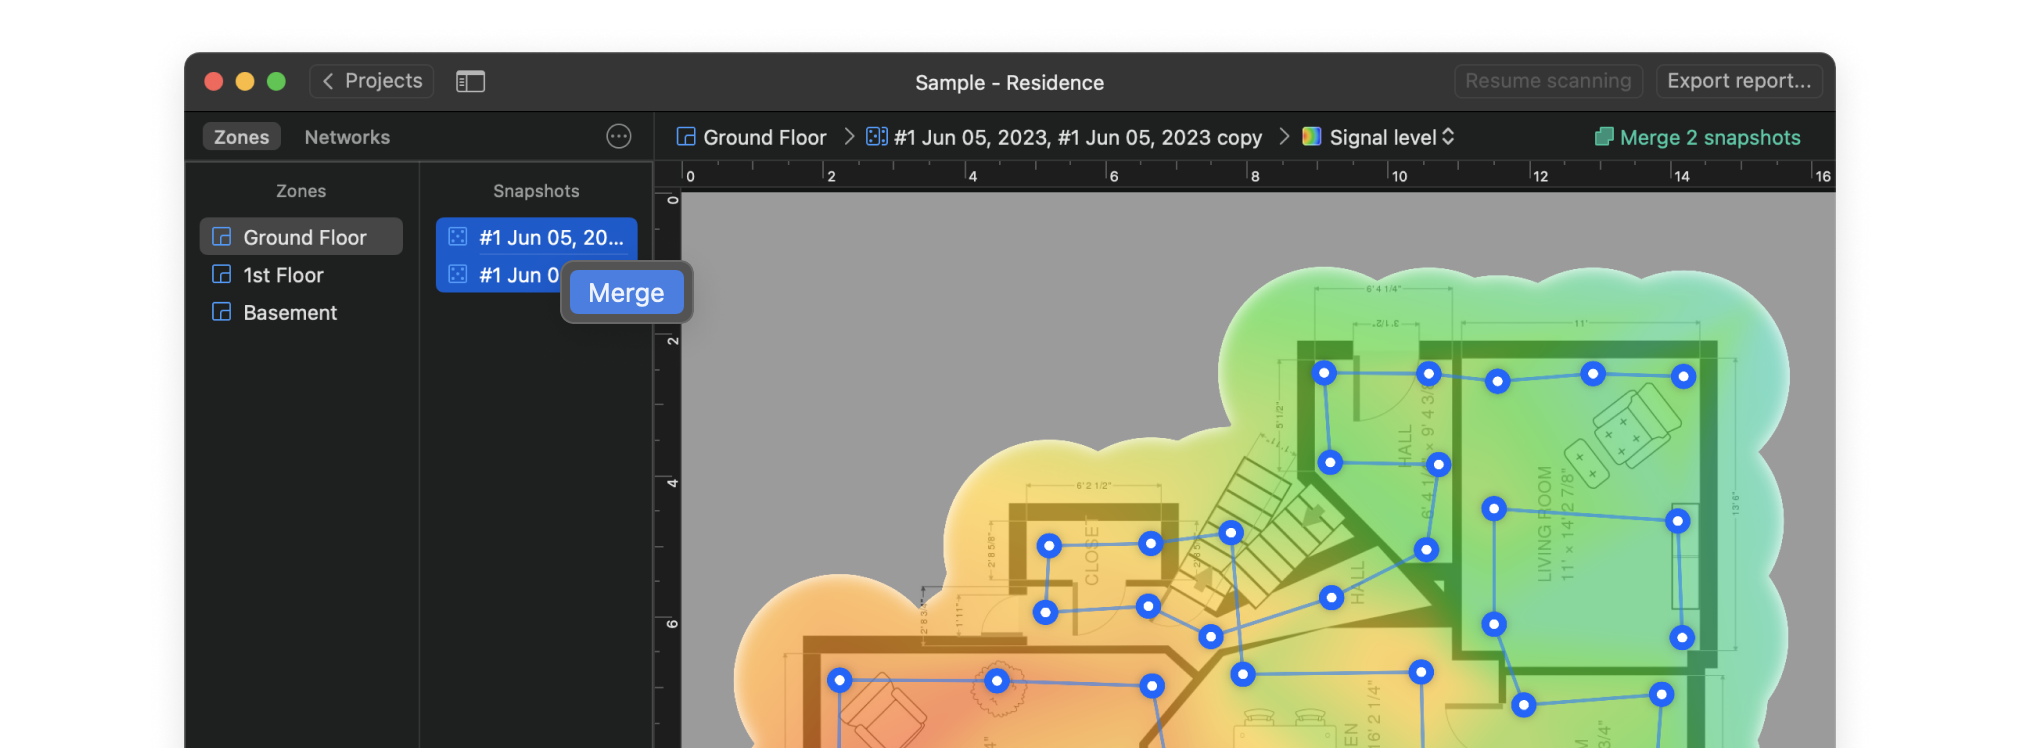
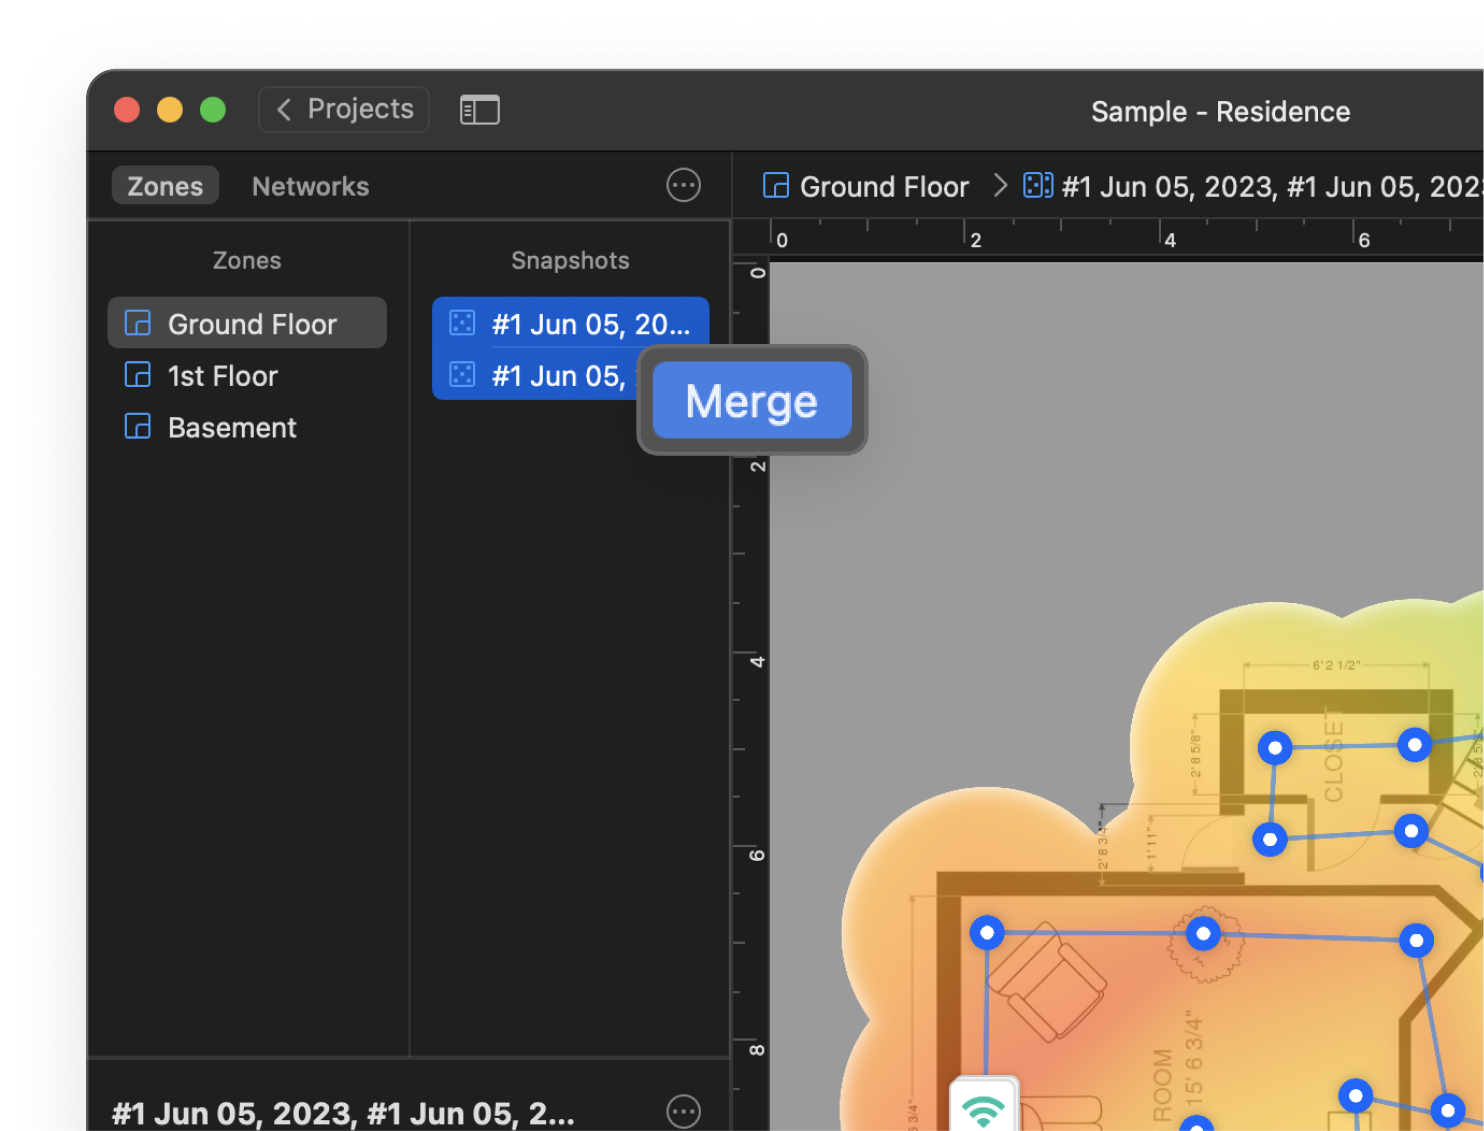
Whether performing an APoS survey or a regular survey in larger spaces, merging your snapshots allows for a complete exhaustive picture leading to a top-notch result.
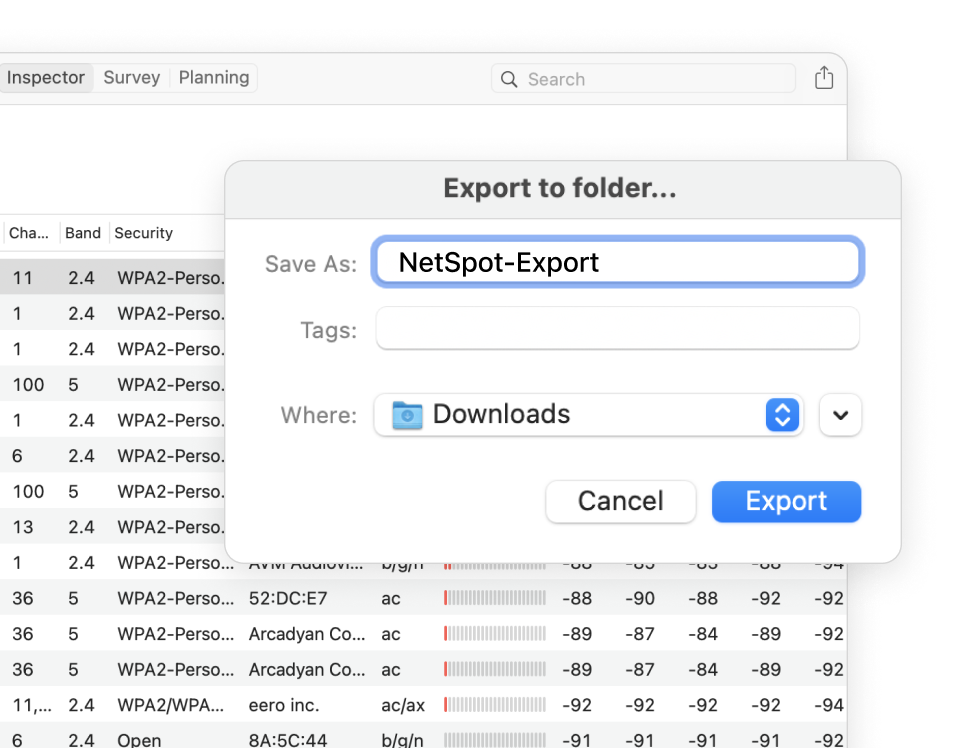
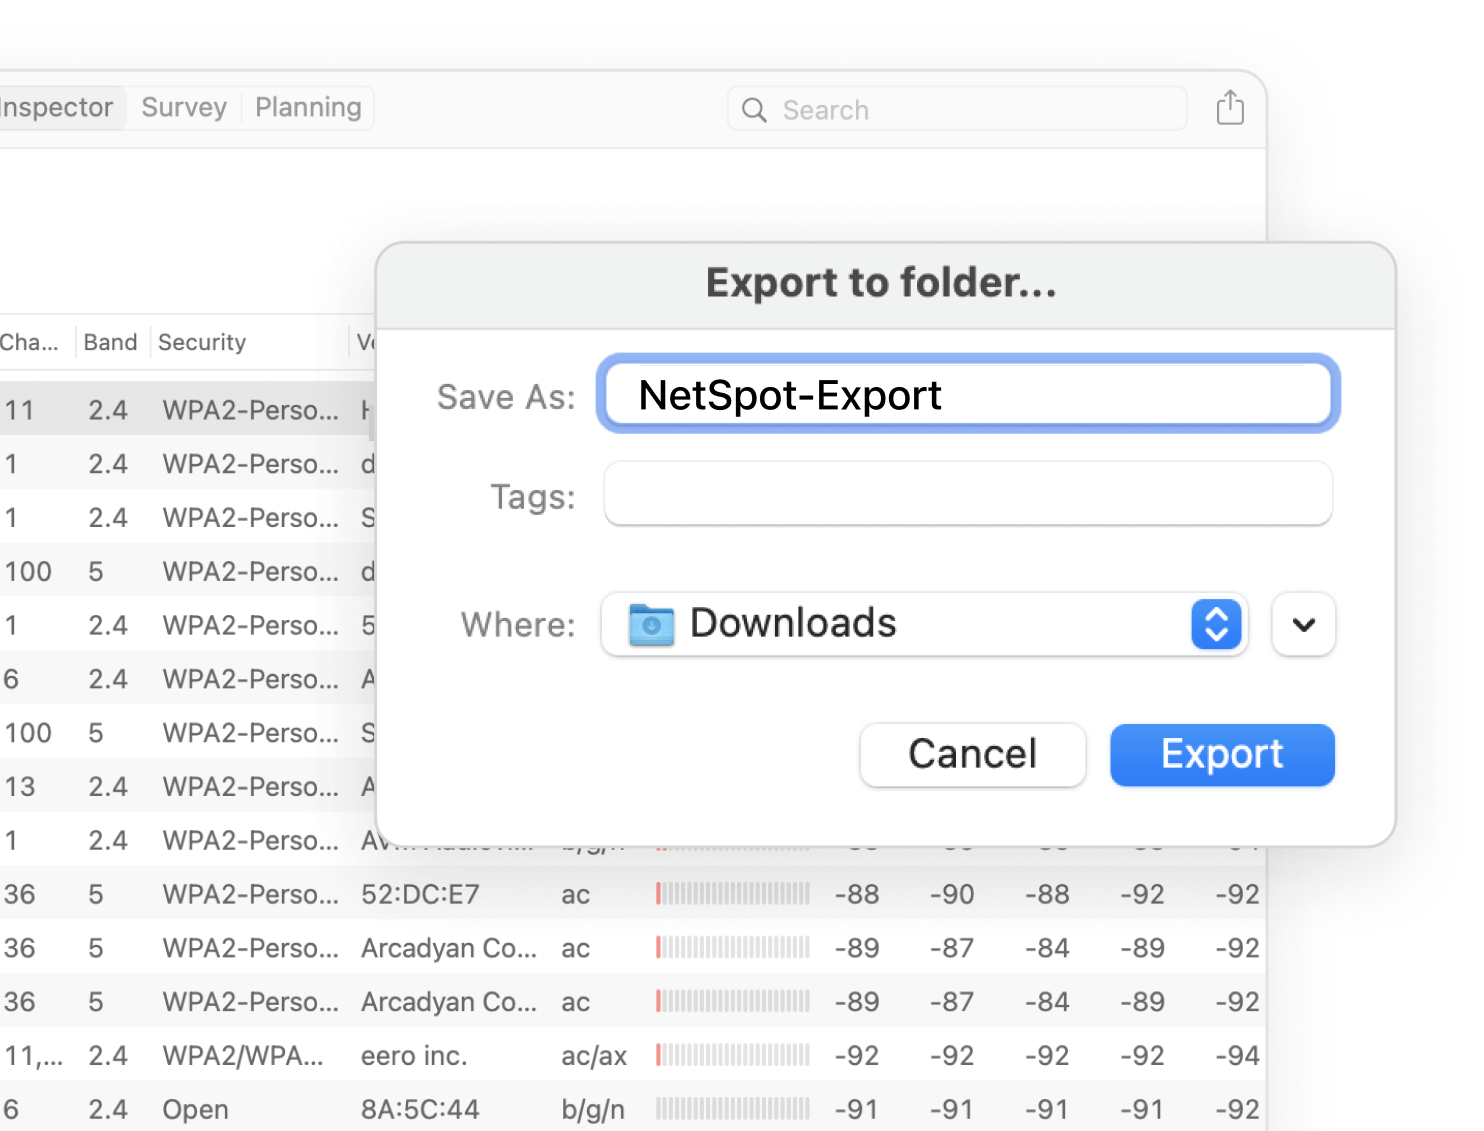
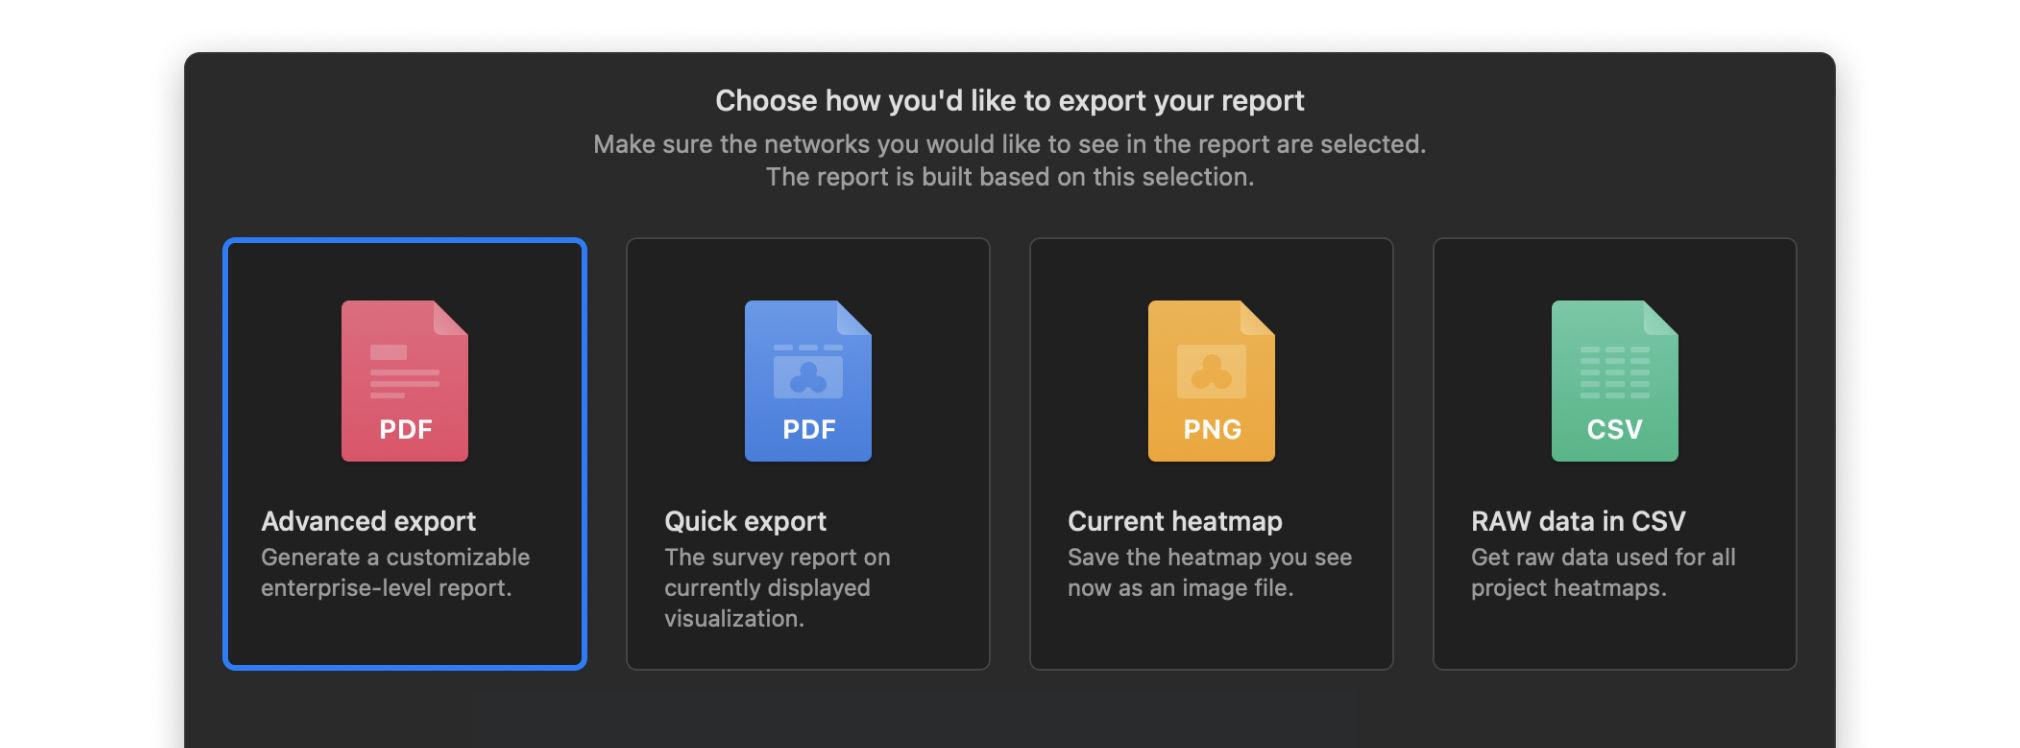
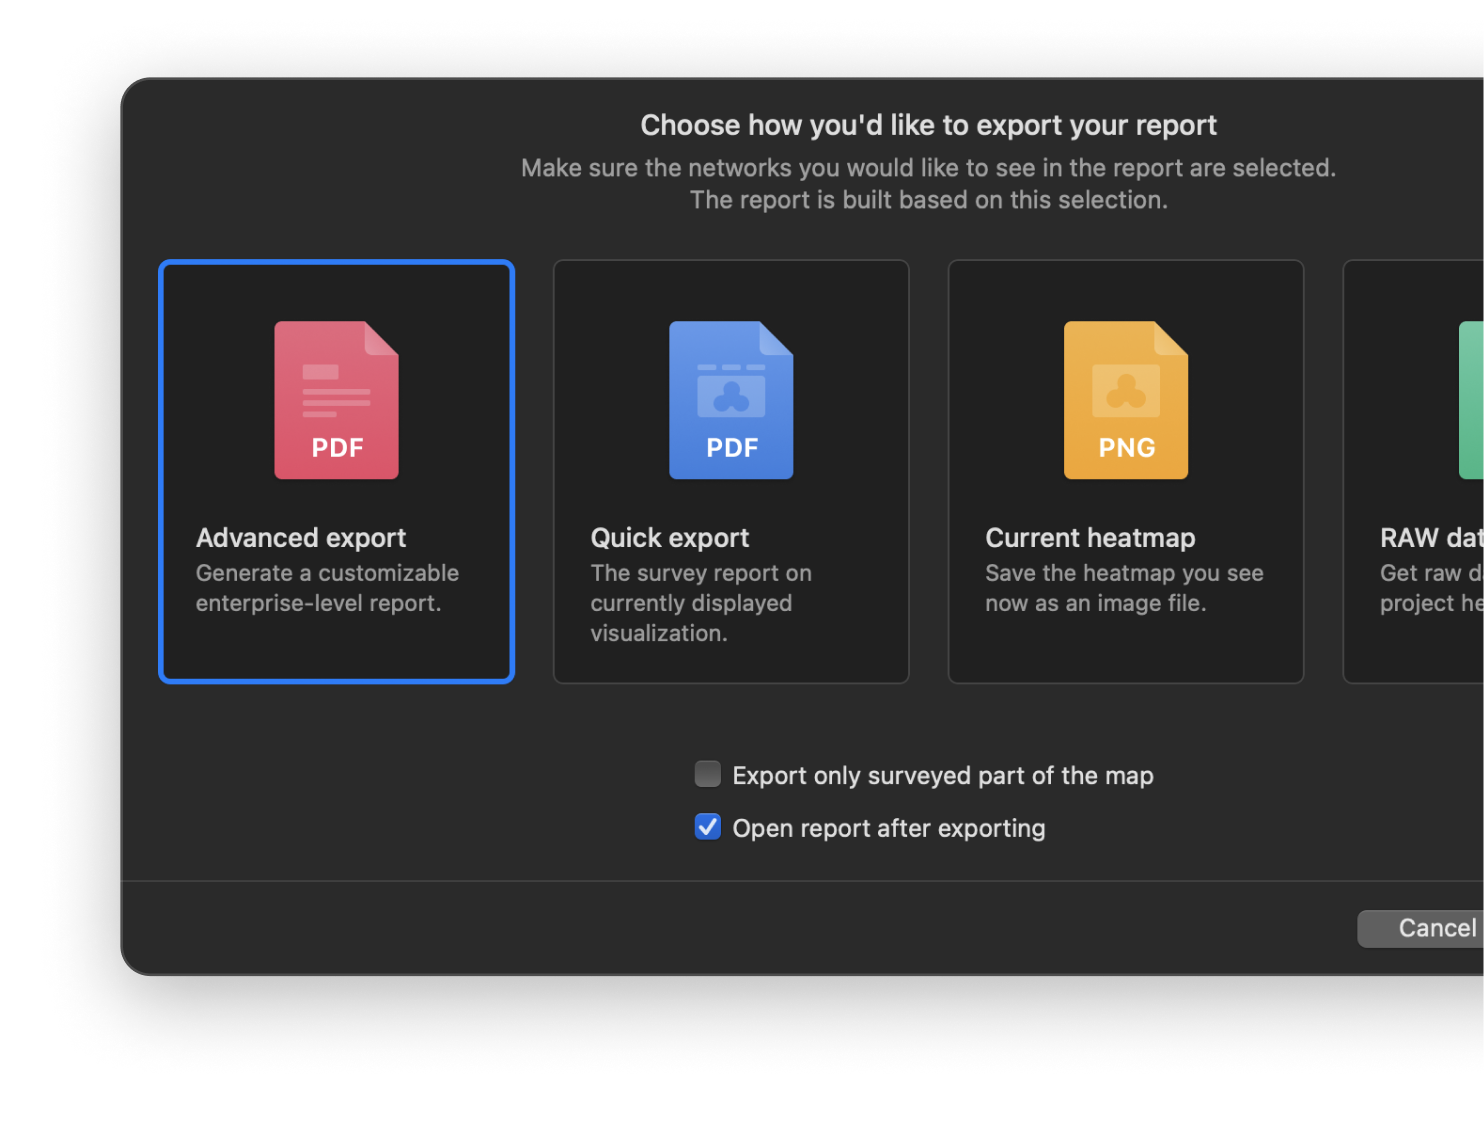
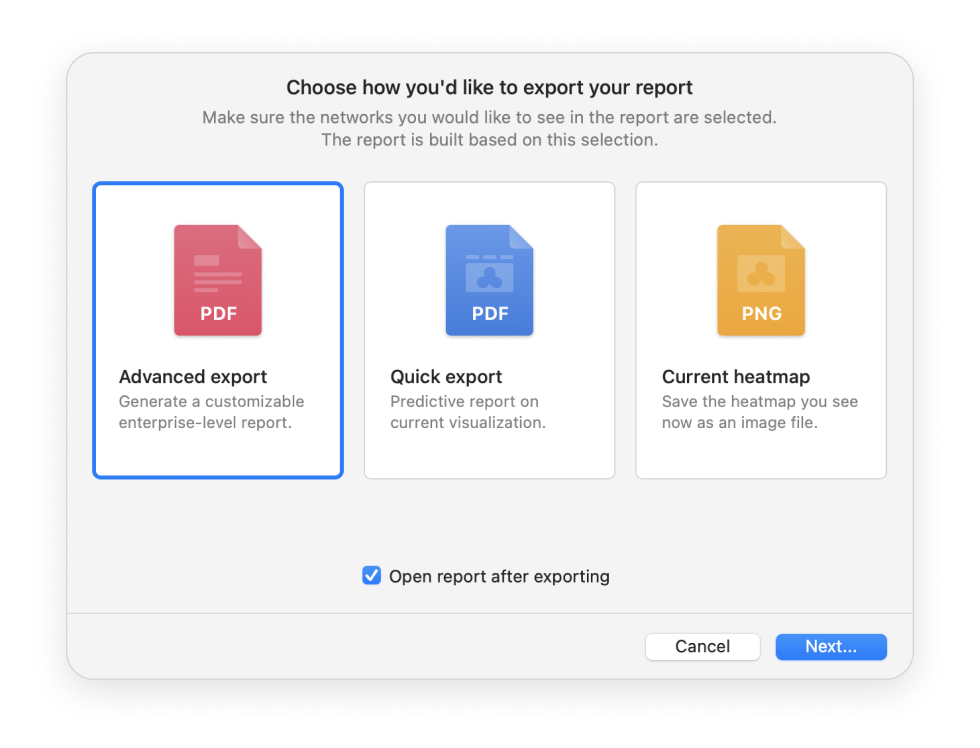
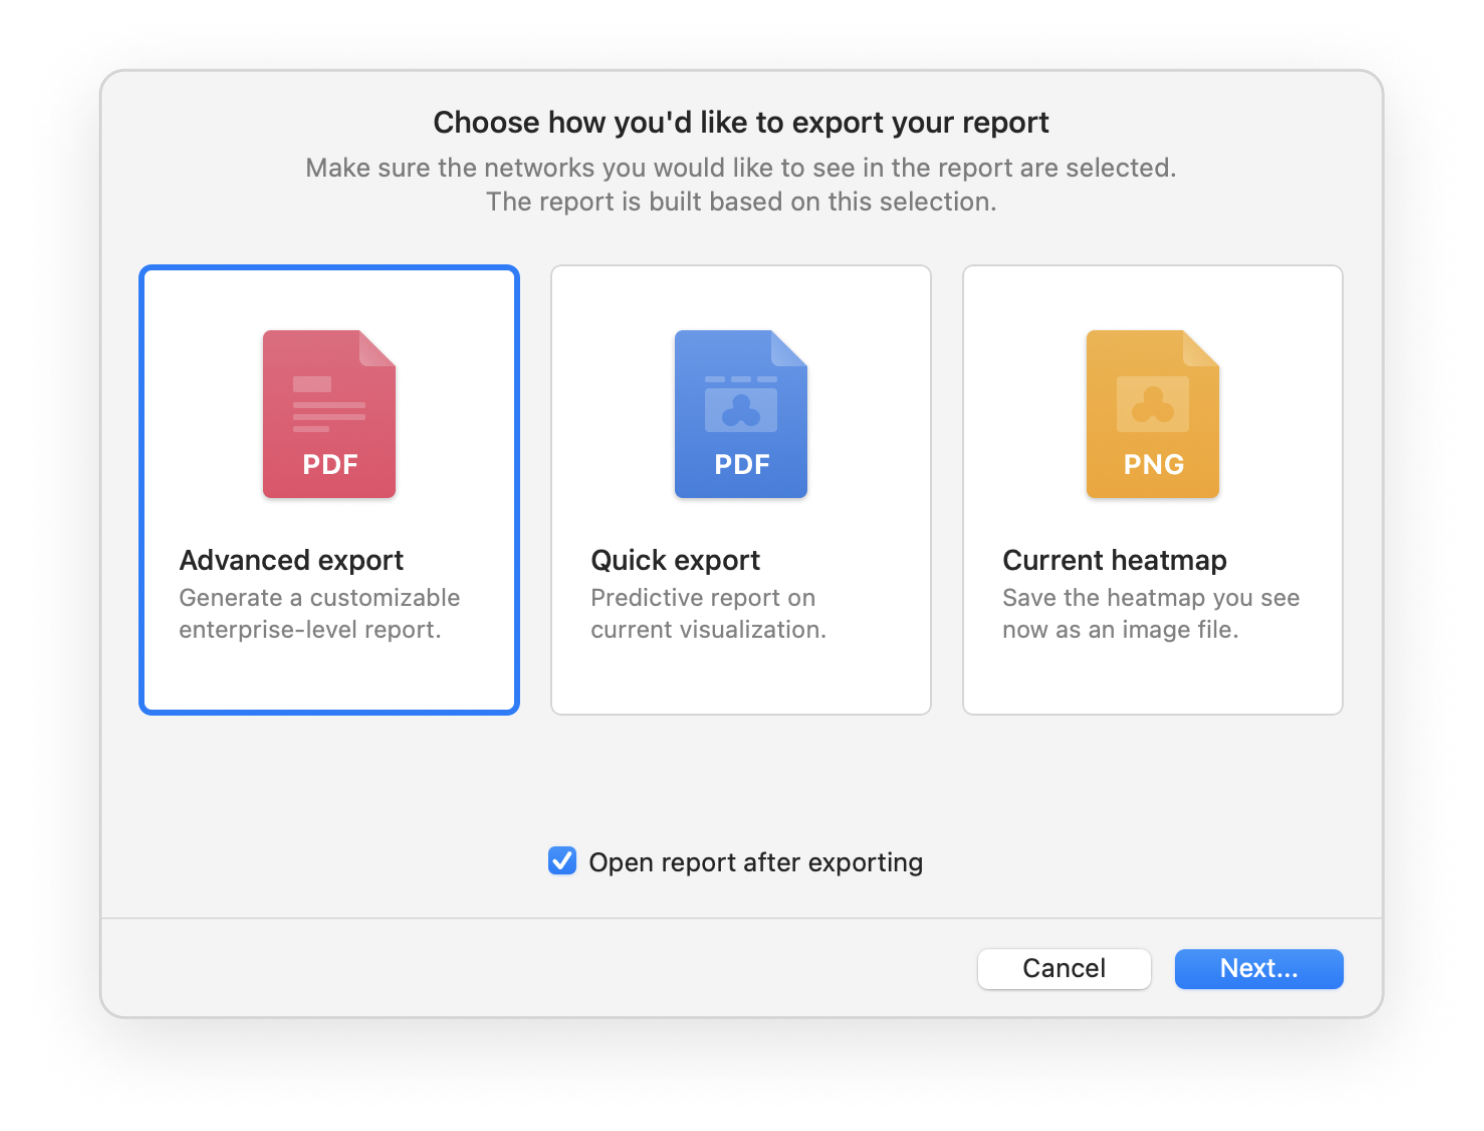
Export your WiFi site survey reports into one of the convenient formats and share them with others. Export to PDF or CSV is available.
Your projects are at the ready — easy to switch between them with just a click.
Multiple types of visual heatmaps allow for easy spotting of the dead zones and tweaking the network setup to eliminate them.
Absolutely no equipment is needed except for your computer or laptop with NetSpot on board to estimate the number of access points the network will need for a smooth and even coverage.
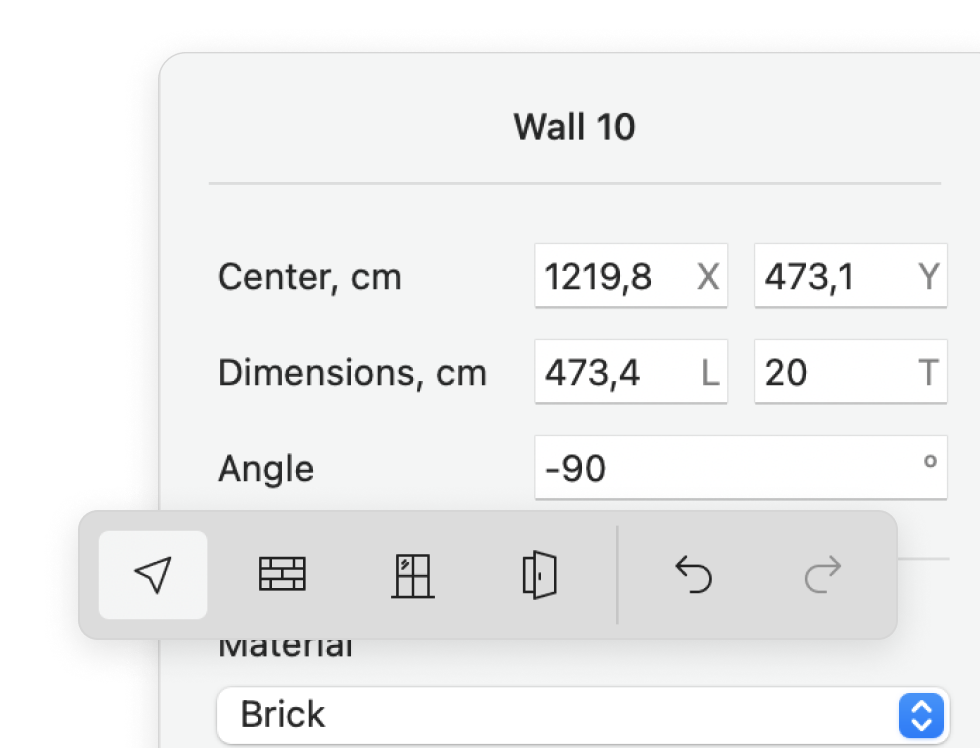
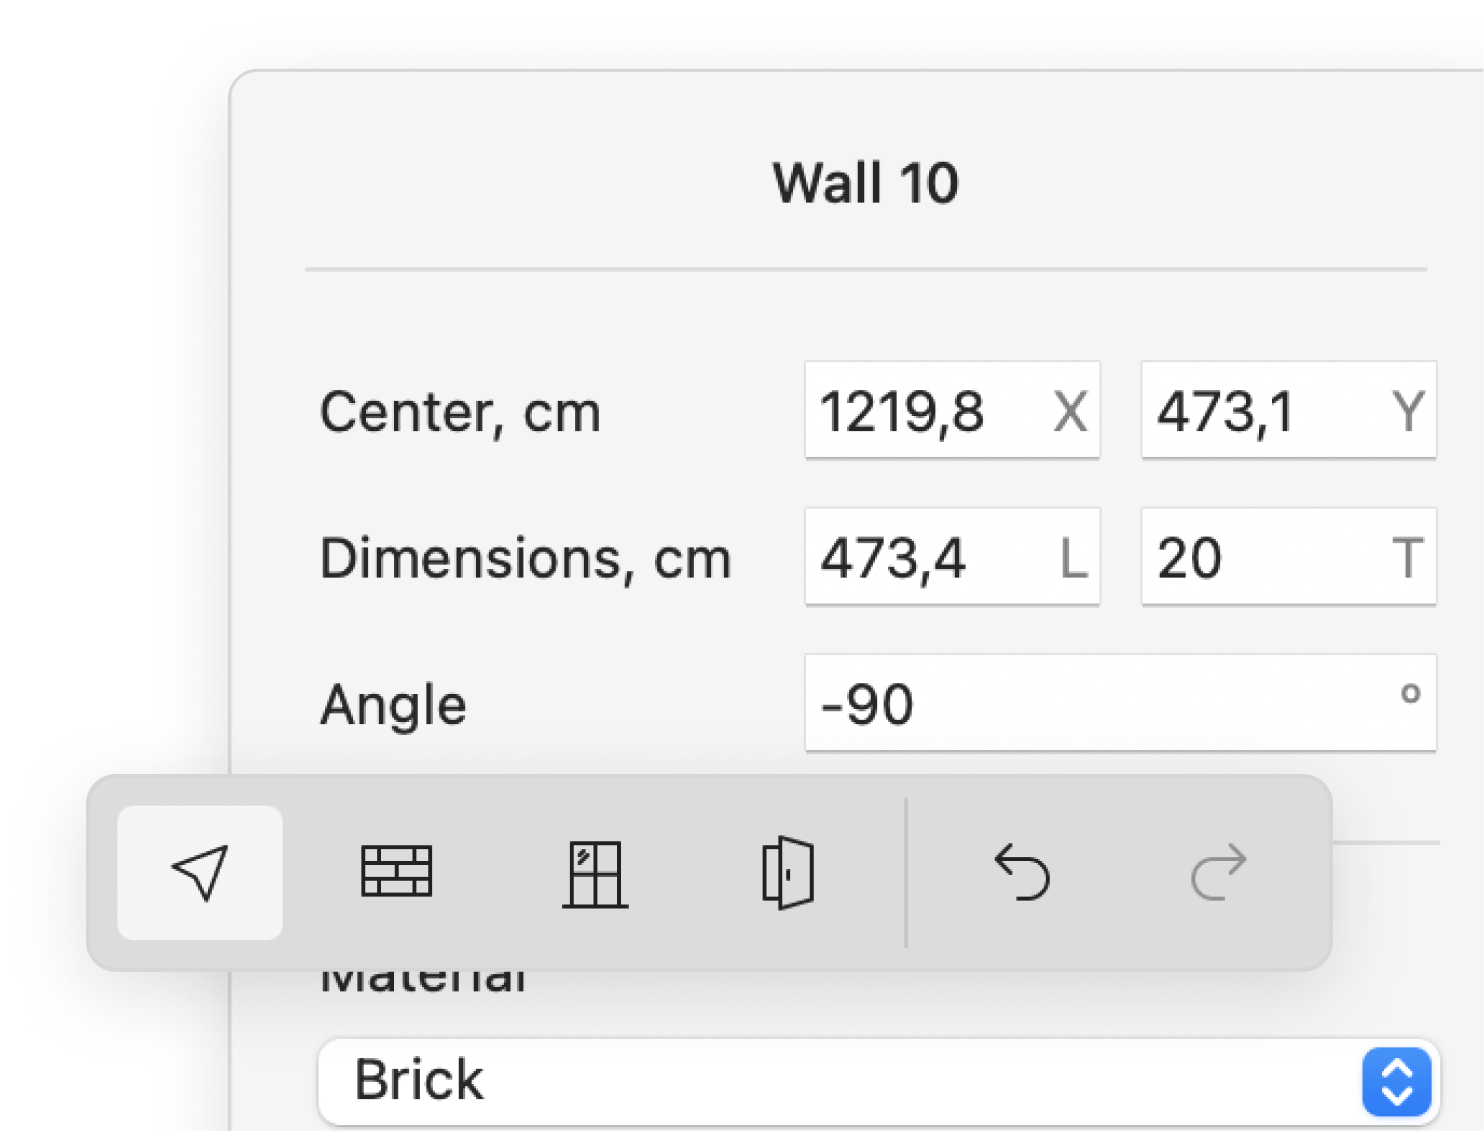
Add the thickness, absorption characteristics, as well as the materials used in the walls, windows, and doors.
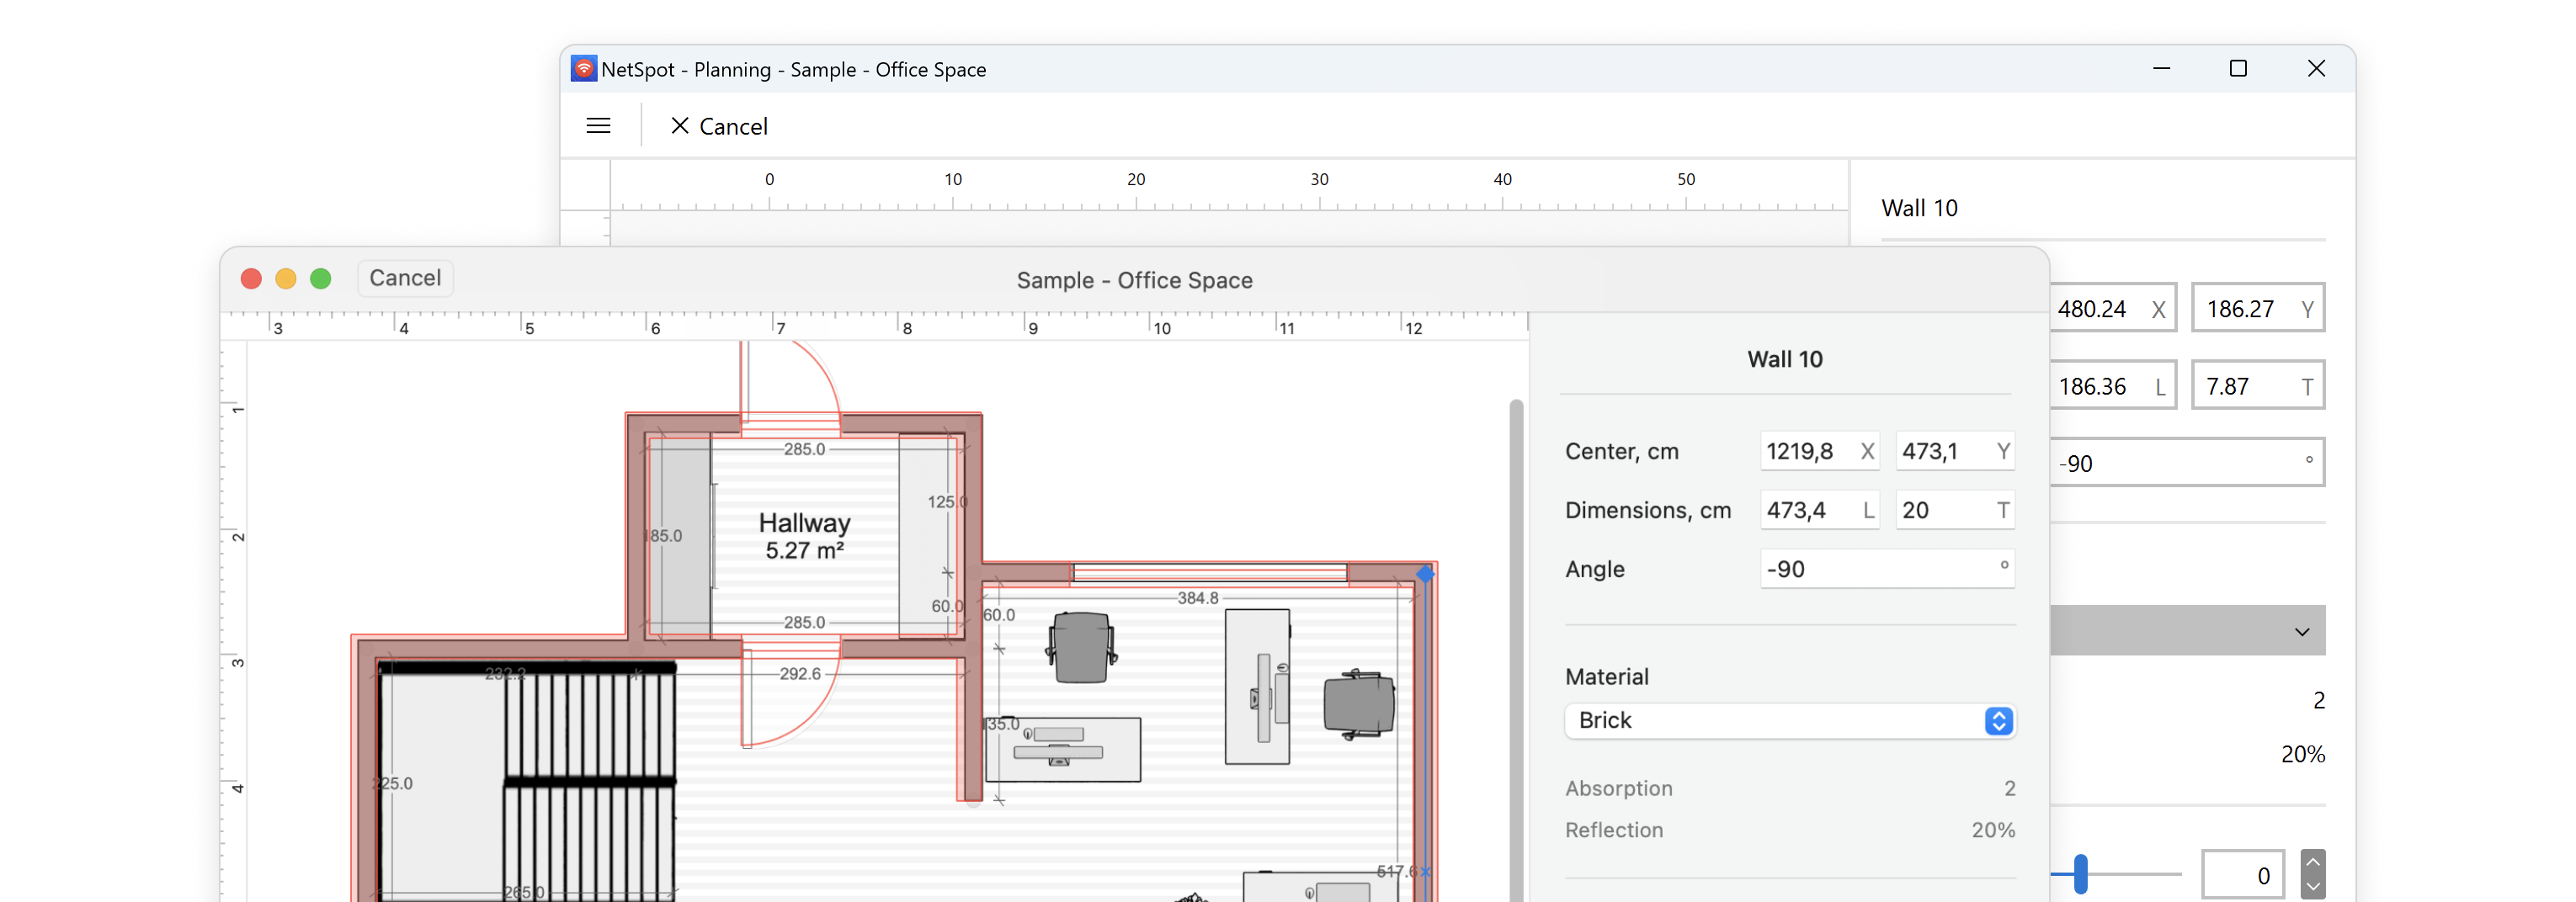
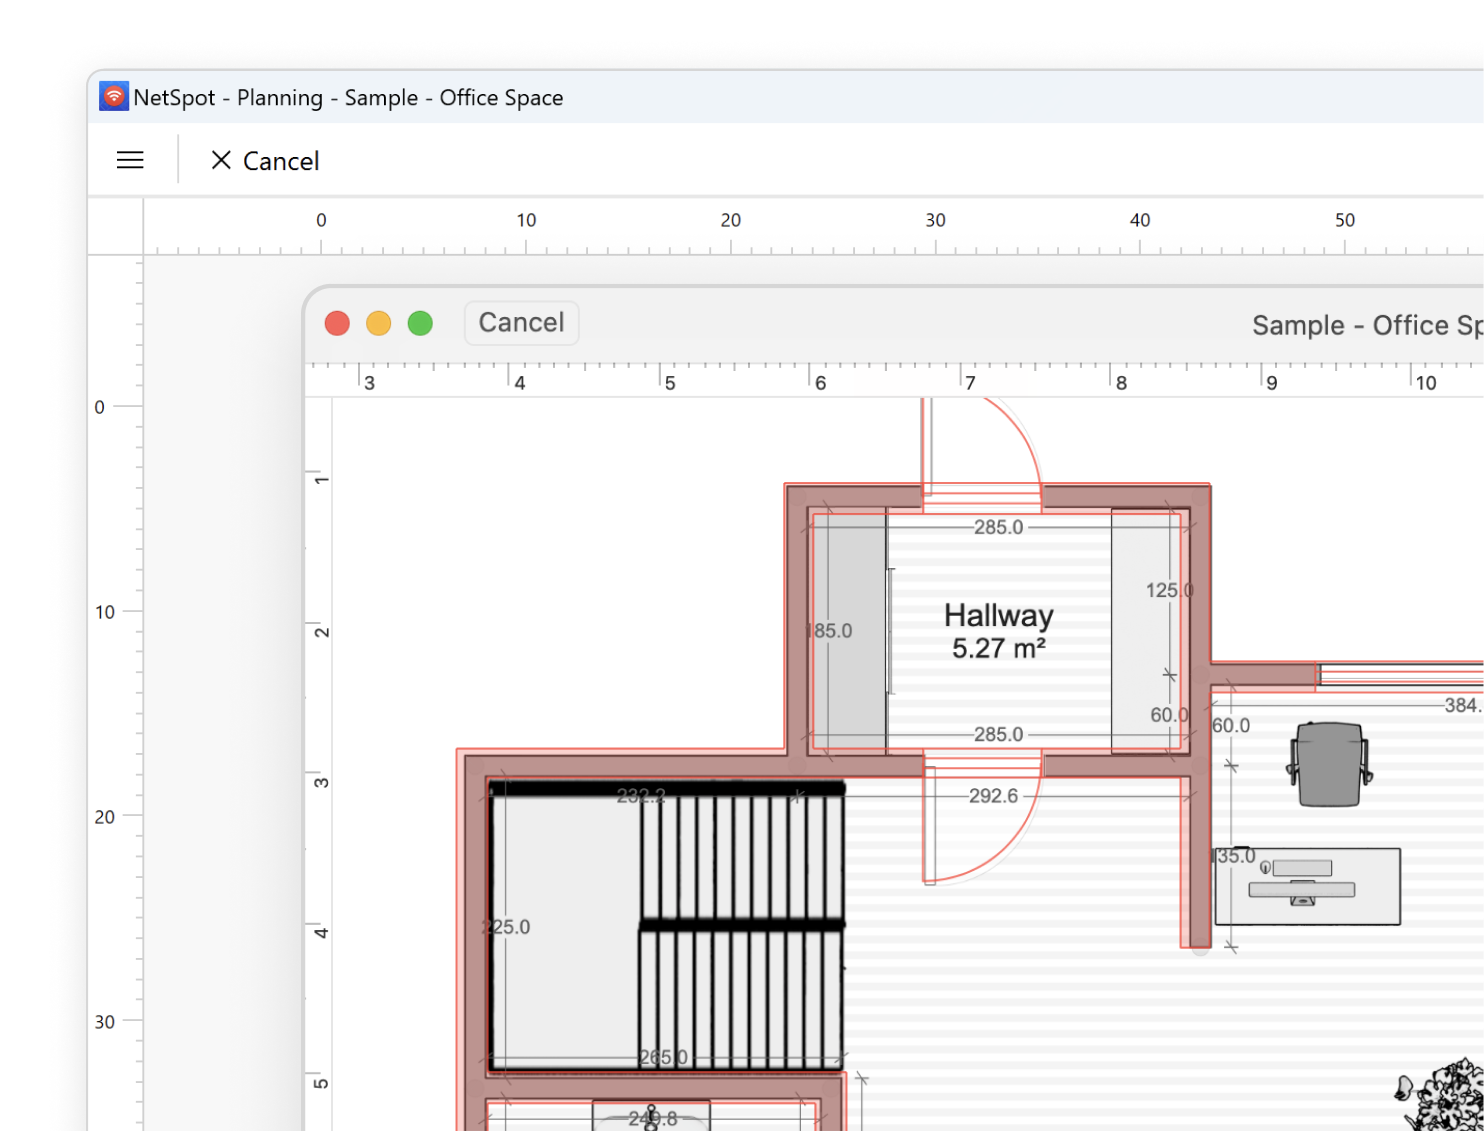
This option, especially helpful when in need of a fast solution, allows simply drawing the plan of your space with all the elements.
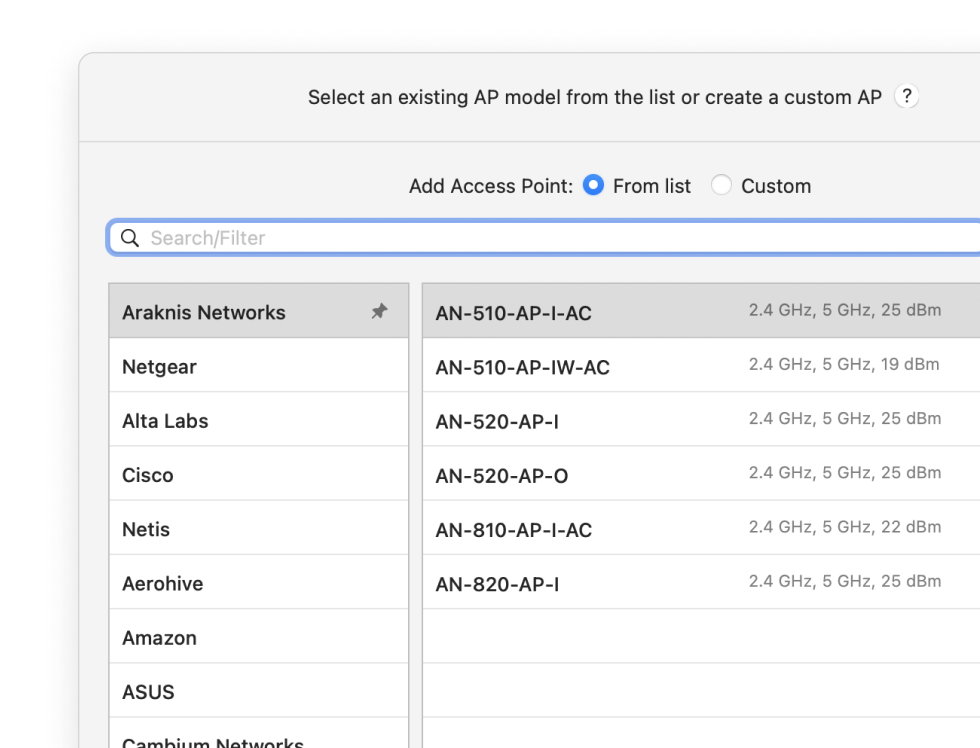
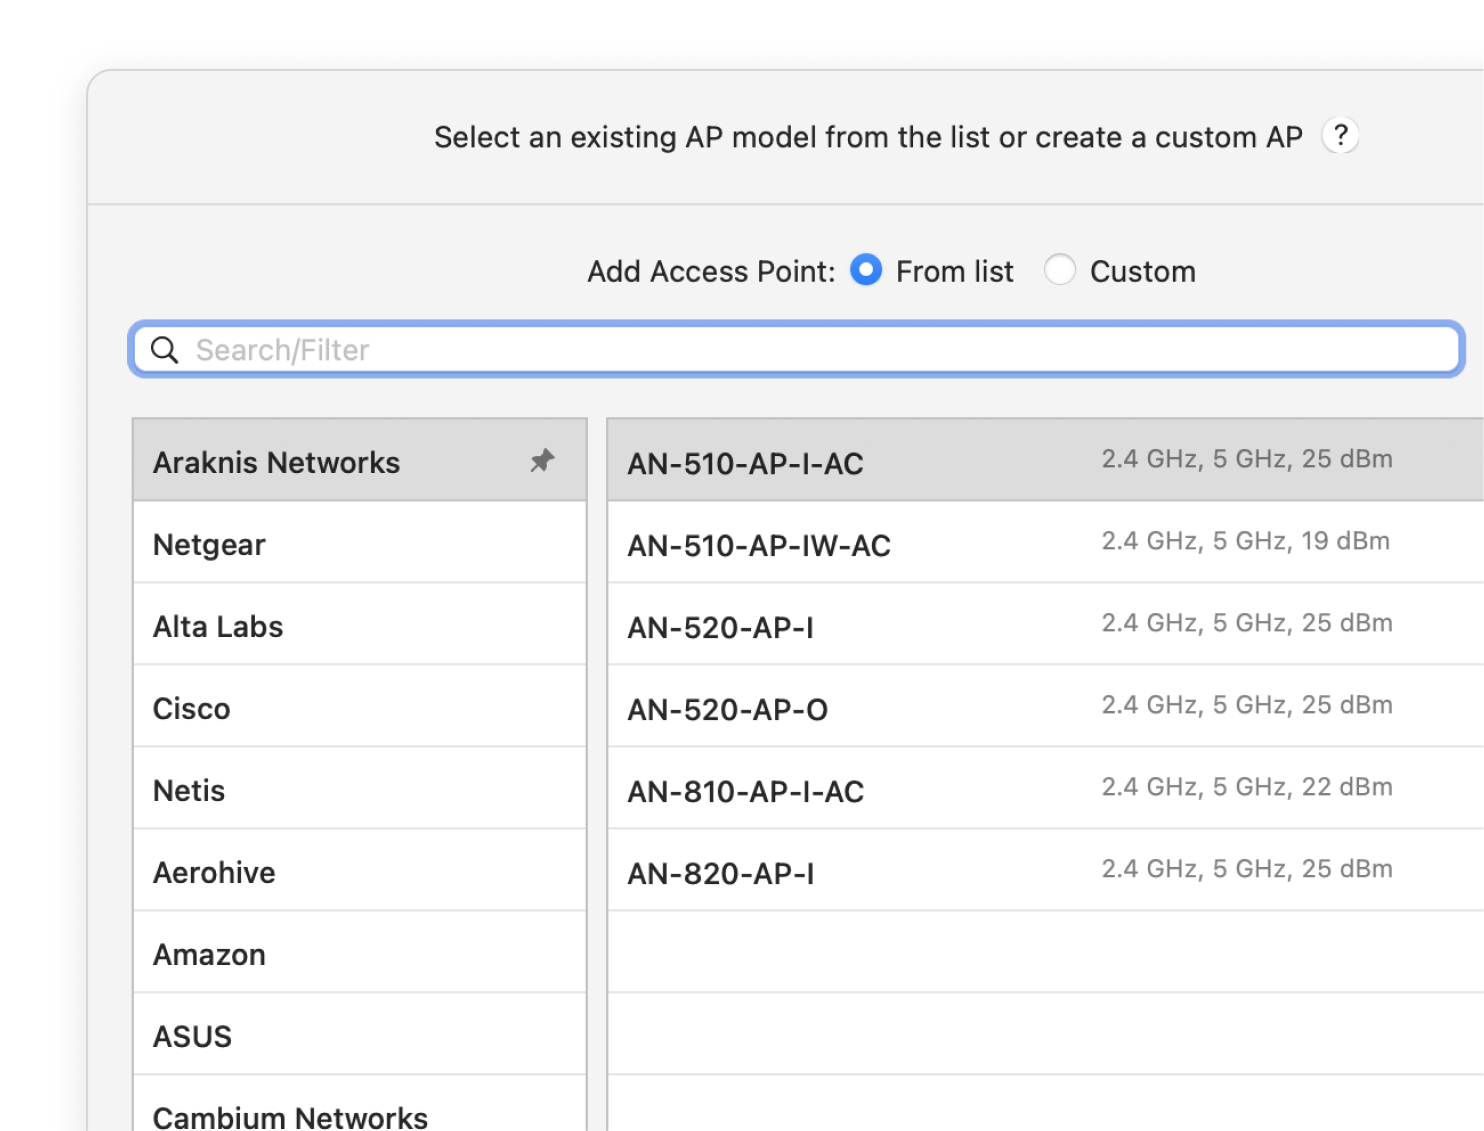
Select a router model you are planning to utilize from an extensive list in the app.
The data you obtain during measurements can be conveniently exported for further analysis.
Map out your space to create and analyze various visualizations for your future wireless coverage.
A WiFi network from scratch, well-built right away? That is easy with NetSpot! We have all the necessary tools ready for you!
Runs on a MacBook (macOS 11+) or any laptop (Windows 7/8/10/11) with a standard 802.11be/ax/ac/n/g/a/b wireless network adapter. Read more about the 802.11be support here.
Your projects are cross-platform and can be opened in NetSpot for macOS, Windows, and Android.