Analyze and compare, perform WiFi site surveys, fix issues with WiFi — all on your Android phone, tablet or Chromebook. You'll need Android 8.0+
How to Create and Read an Android WiFi Heat Map
To create a detailed Android WiFi heat map, you don’t need anything else besides your Android device and a specialized Android WiFi heatmapper, such as NetSpot WiFi heatmap software.
WiFi heat mapping is the process of recording wireless signal coverage and strength and visualizing it on an interactive map of a room, floor, or perhaps some outdoor area, just to give three examples.
Introduction to Wi-Fi Heat Mapping on Android
There are several different reasons why WiFi heat maps are useful and well worth the time and effort they take to create:
- Network visualization: Wireless networks can be somewhat difficult to optimize because you can’t exactly see with your own eyes where strong WiFi signal ends and weak WiFi signal begins — at least not without a WiFi heat map guiding you along the way.
- Accurate planning: It’s easy to make a mistake when planning and deploying a WiFi network, and its consequences can greatly affect all users of the network, preventing them from achieving optimal download and upload speeds. Having a WiFi heat map at hand can go a long way in helping you design a network that meets its users’ requirements immediately after going live.
- Educated problem-solving: Discovering causes of WiFi signal weakness, bottlenecking, and connection drops can be a time-consuming ordeal unless you can base your decision-making process on concrete data, which is exactly what a WiFi heat map can provide.
Android WiFi mapping can be performed using any modern Android device capable of running an Android WiFi heatmapper app. Using the right app, you can get the same results as when building a WiFi heatmap on Windows or macOS.
How to Choose a Wi-Fi Heat Map App for Android?
Most WiFi heatmap Android apps work more or less the same:
Install the app on your Android device.
Launch the app and either load or create a map of the area you want to survey.
Move from one part of the area to the next until you’ve covered it completely.
Study the created WiFi heat map to discover areas of signal weakness and other potential problems.
Implement desired changes and, optionally, create a new WiFi heat map to check if you’ve successfully achieved the desired result.
But just because WiFi heat map apps for Android all work more or less the same doesn’t mean that they all deliver the same high-quality results. Here are a few tips to help you choose the best WiFi mapper for Android:
- Pay attention to user reviews: The Google Play Store lets users publish reviews and rate apps, and we highly recommend you pay attention to them because they can tell you a lot of useful information about Android WiFi heatmappers.
- Stick with established developers: Developing an accurate and reliable heatmapper for Android is not easy, and keeping it updated and compatible with the new versions of the mobile operating system is even more difficult. Established developers have the experience and technical knowledge to complete this difficult objective, so sticking with them is a safe bet.
- Try before you pay: To avoid spending money on a WiFi heat mapping Android app that doesn’t meet your requirements or doesn’t live up to its promises, we recommend you focus on apps that offer a free trial version.
What You Need to Know Before Building Wi-Fi Heat Maps?
Building a WiFi heat map isn’t difficult, especially not if you use a popular WiFi mapping Android app with an easy-to-use user interface. Still, there are some things you should know before you build your first WiFi heat map so that you obtain the most accurate results possible:
- It’s a good idea to create the same map at different times of the day and compare the results.
- Your Android device may influence the results, so close as many background apps as possible.
- Keep in mind that many appliances and electronic devices cause interference, so avoid standing too close to them when measuring.
You should also learn the difference between different kinds of Wi-Fi heatmaps, including:
- Signal level: Shows how strong the WiFi signal is throughout the area, helping you spot weak zones where connectivity could be unreliable.
- Signal-to-noise ratio: Focuses on areas where interference affects network quality. Identifying locations with poor signal-to-noise ratios lets you address channel overlap and improve overall performance.
- Signal-to-interference ratio: Highlights spots where other networks interfere with your WiFi. This makes it easier to find overlapping channels and adjust settings to reduce disruptions.
- Quantity of access points: Helps visualize the density of access points in your area, allowing you to detect overlapping networks that might be causing interference.
- Frequency band coverage: Highlights which bands (2.4 GHz, 5 GHz, or 6 GHz) are more effectively covering specific areas. This is especially helpful when working with modern networks.
- Download speed: Shows areas with slower data download rates, helping identify weak signals or congestion for targeted optimization.
- Wireless transmit rate: Displays the speed of data transmission between devices and access points, helping to identify areas with suboptimal speeds caused by weak signals or network congestion.
- Issues with SNR: Highlights zones with poor signal-to-noise ratios, helping to identify areas where interference and weak signals might lead to connectivity problems.
- Low signal level: Pinpoints areas where the WiFi signal strength is too weak to provide reliable connectivity, suggesting locations that might require additional coverage.
- Overlapping channels (SIR): Visualizes areas where channels overlap, helping you identify interference and adjust channel settings to avoid performance degradation.
- Low download rate: Shows zones where download speeds are below optimal levels, allowing you to troubleshoot potential causes like interference, weak signals, or network congestion.
You can create these WiFi heatmaps with NetSpot for Windows and macOS using data collected by your Android device running NetSpot for Android.
Android Wi-Fi Heat Maps with NetSpot
NetSpot is a popular professional app for wireless site surveys that’s accessible even to casual users who don’t have an in-depth understanding of wireless networks. It runs on all WiFi-equipped computers with macOS 11+ or Windows 7/8/10/11 and is designed to work alongside the NetSpot Android app.
NetSpot for Android lets you quickly and easily collect important information about surrounding wireless networks and observe the changes in data charts in real time. It also features a powerful Planning mode that allows you to design and simulate a WiFi network before installing any hardware — try out various access point models, explore different placements, and observe how the signal responds within your space, considering its materials and layout.
Best of all, the app can now be used to perform a WiFi site survey and generate Wi-Fi heatmaps on your Android device (three major heatmap types are available as one in-app purchase). What makes the survey process even more flexible is that you’re not limited to using a ready-made floor plan.
You can upload a digital blueprint if you have one, snap a quick photo of a printed layout, or — if none of that is available — just tap “Create Layout” and start with a blank canvas. All you need to do is enter the dimensions of your space and choose a marker size, and you're ready to begin collecting data.
You can also use all data gathered with NetSpot for Android to create a multitude of heatmaps in your licensed desktop version of NetSpot.
NetSpot’s approach to heat mapping offers great advantages. First, WiFi heat mapping Android apps are far more convenient to use on site because they don’t require you to haul around a bulky laptop. Second, you get the opportunity to generate the most popular Wi-Fi heatmaps directly on your mobile device.
And, last but not least, you can go back to your laptop or desktop, and generate all other Wi-Fi heatmap types in your registered NetSpot for desktop to perform the most detailed visual analysis of your wireless network.
Here’s How you can create Android WiFi heat maps with NetSpot:
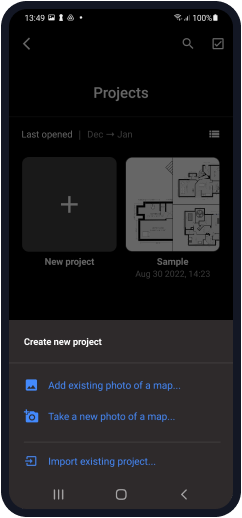
First, you need to create a new project by clicking the + button.
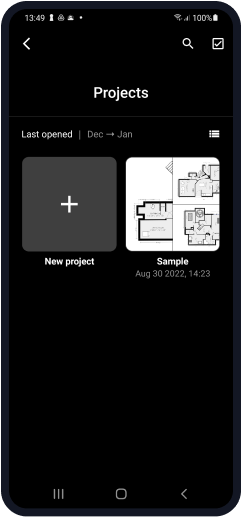
Choose the file of your site from the library or take a photo of a map.
Give your project a name (such as ‘My office’) and briefly describe your project (Description).

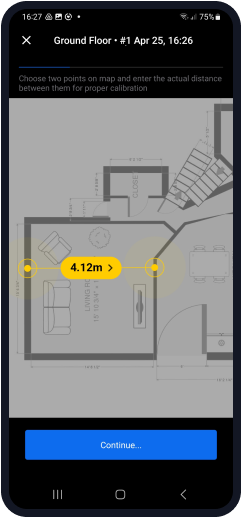
Calibrate your map: select any two points on the map, enter the real distance between them, and confirm the correct measurement unit (feet or meters).
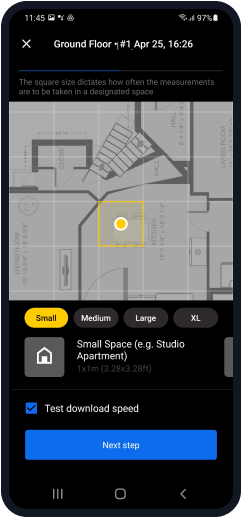
Set the area type. Choose the size of your site (small, medium, large, x-large).
Start scanning: you have to take at least 3 sampling points to build a heatmap.
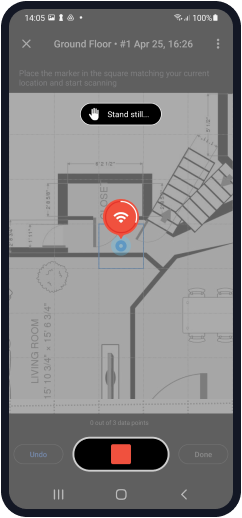
Once your WiFi site survey is finished, you can either build WiFi heatmaps on your Android device (three major types are available via a single in-app purchase) or export the project to your Mac or Windows computer to view and analyze the various heatmaps in the desktop version of NetSpot.
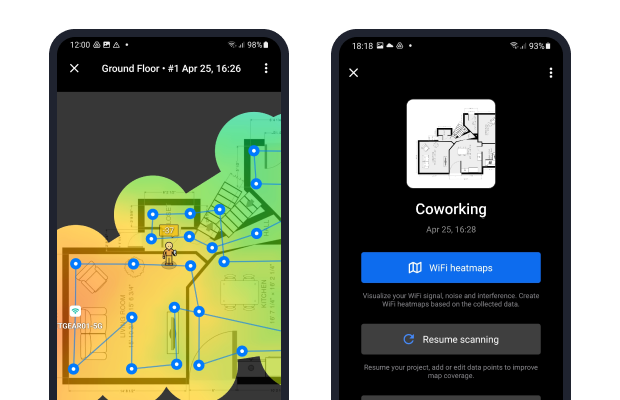
NetSpot simplifies the process of interpreting WiFi heat maps by using a clear and intuitive color system: red represents a strong signal (hot), green indicates an average signal, and blue shows a weak signal (cold).
You can create many different types of WiFi heat maps with NetSpot for Windows and macOS, and switching between them is as easy as clicking a button.
Conclusion
Your Android device can tell you a lot of useful information about nearby WiFi networks if you equip it with a powerful Android WiFi heatmapper like NetSpot. As we’ve described in this article, creating a detailed WiFi heat map isn’t difficult, and the benefits of seeing your coverage visualized on a map are numerous.
Android WiFi Heat Map — FAQs
To heatmap your WiFi network, you need just two things: an Android device and a WiFi heatmap app for Android, such as NetSpot. Create a new project in the app, calibrate your map, take sampling points, and analyze the results.
If your heatmap reveals areas with a weak signal:
- Look for interference caused by other devices, like cordless phones or microwaves.
- Adjust the router's position to ensure better coverage.
- Switch to less congested channels or a different frequency band (e.g., 5 GHz or 6 GHz).
- Consider upgrading to a router that supports WiFi 6 or WiFi 6E for better range and performance.
A heat map is a visualization of WiFi signal distribution, and it can be used to highlight areas of signal weakness, the quantity of access points, and other important information.
Check our picks for the best WiFi heatmap software.
Typically, WiFi signal becomes stronger the closer you move to your WiFi router. Knowing this, you can create a WiFi signal heat map with a WiFi heatmapper like NetSpot and use it to determine where the signal is the strongest. That’s likely the direction the signal is coming from.
There are several great WiFi analyzers for Android, but the one we always recommend is NetSpot. Why? Because NetSpot combines user-friendly design with powerful features, offering detailed insights into your WiFi network to help improve its performance and coverage.

Analyze and compare, perform WiFi site surveys, fix issues with WiFi — all on your Android phone, tablet or Chromebook. You'll need Android 8.0+