Wi-Fi Site Surveys, Analysis, Troubleshooting runs on a MacBook (macOS 11+) or any laptop (Windows 7/8/10/11) with a standard 802.11be/ax/ac/n/g/a/b wireless network adapter. Read more about the 802.11be support here.
What Is a Wi-Fi Heatmap
IF YOU’VE NEVER HEARD THE TERM “WI-FI HEAT MAPS” BEFORE, THEN KEEP ON READING BECAUSE YOU’RE ABOUT TO LEARN WHAT WI-FI HEAT MAPS ARE, HOW THEY ARE USED, AND HOW YOU CREATE THEM YOURSELF USING NETSPOT.
Jump to...
What Is a Wi-Fi Heatmap?
A Wi-Fi heatmap is a map of wireless signal coverage and strength. Typically, a Wi-Fi heatmap shows a real map of a room, floor, or even a city overlaid by a graphical representation of a wireless signal.
Professional network administrators and regular home users alike use Wi-Fi heatmaps to find dead zones and make adjustments to achieve the desired coverage.
")
Without a heatmap, wireless network optimization involves a lot of guesswork, which is why most people who are not aware of the existence of Wi-Fi heatmap software never manage to achieve the Wi-Fi coverage they would like to have and end up with suboptimal network performance and frustrating connectivity issues.
Wi-Fi heat map software fully automates the process of mapping Wi-Fi coverage on a map, allowing anyone to create a Wi-Fi heatmap in a matter of minutes just by walking from one place to the next until the entire area is mapped.
With Wi-Fi heat maps you can identify areas with strong and weak coverage, pinpointing where signals may need boosting or where devices might struggle to connect reliably.
Potentially reveal where neighboring networks or physical obstructions introduce interference, impacting signal quality. And indicate instances where too many Wi-Fi networks broadcast on the same channel, leading to congestion and performance issues. And much more!
)")
This information can then serve as your blueprint for achieving comprehensive, efficient coverage, making it easy to improve the placement of your router, change important Wi-Fi settings, or make well-thought-out network upgrades.
How Do Wi-Fi Heatmaps Work?
We’ve explained that a Wi-Fi heatmap is a map of a wireless signal, but how does Wi-Fi heat mapping software create it? While there are many different Wi-Fi heatmappers to choose from, the process is usually fairly similar.
A user equipped with a laptop or smartphone with a Wi-Fi heat map software application enters the premises and either loads up an existing map of the area or creates one from scratch.
He or she then begins the heat mapping processing, carrying the laptop or smartphone from one location to the next, recording where Wi-Fi is working well and where the signal is too weak for web pages to load quickly. At each point, the wireless heatmap software collects detailed data on signal strength, noise levels, interference, and more to provide a comprehensive analysis of the network's performance.
After analyzing the gathered data, the Wi-Fi heat map software application creates a map overlaid with traffic light-style color spectrum, showing areas of the greatest signal strength as well as the greatest signal weakness. This visual representation allows users to quickly identify dead zones and areas where the wireless heat map indicates potential issues.
")
Besides Wi-Fi strength heatmaps, most Wi-Fi heatmappers can also create other visualizations and capture all kinds of information, ranging from signal-to-noise ratio to noise level to frequency band coverage. Some advanced tools, such as NetSpot, can even simulate how changes in router placement or settings might improve the network.
How to Create a Wi-Fi Heatmap with NetSpot?
Creating a Wi-Fi heatmap with NetSpot is straightforward, requiring no technical expertise because the wireless analyzer tool streamlines the entire process. Whether you’re setting up a new network or optimizing an existing one, NetSpot’s user-friendly interface makes it accessible for everyone. Here’s how it works:
Step 1
Download and install NetSpot on your device, then launch the application.
Step 2
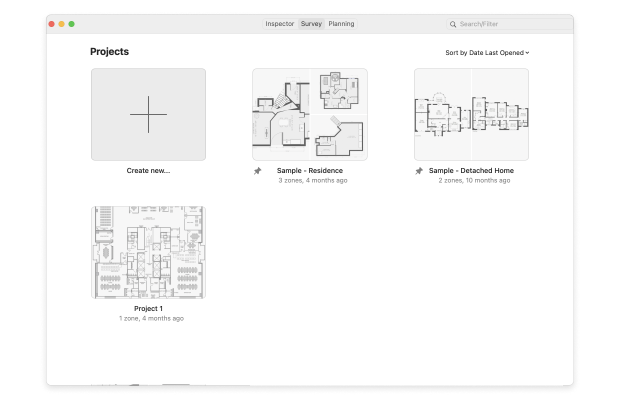
Switch to the Survey mode using the buttons in the top toolbar. This mode allows you to collect Wi-Fi data for creating your heatmap.
Step 3
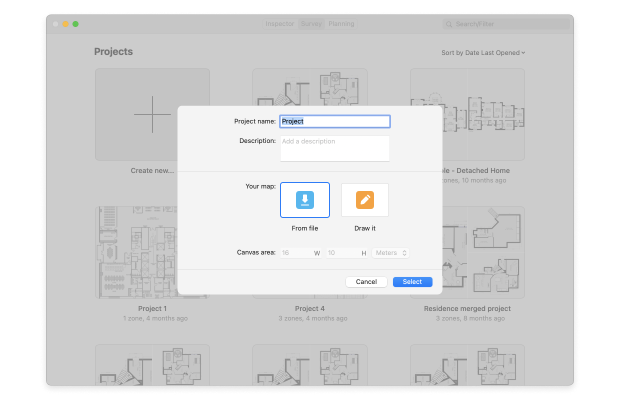
Click the Create New… button and give your Wi-Fi heatmap project a meaningful name. You can also add a description if you like.
Step 4
Either provide an existing map of the area you want to survey or create one using the map creator included with NetSpot. For the purposes of this tutorial, we’ll use the built-in map creator to draw our survey area.
Step 5
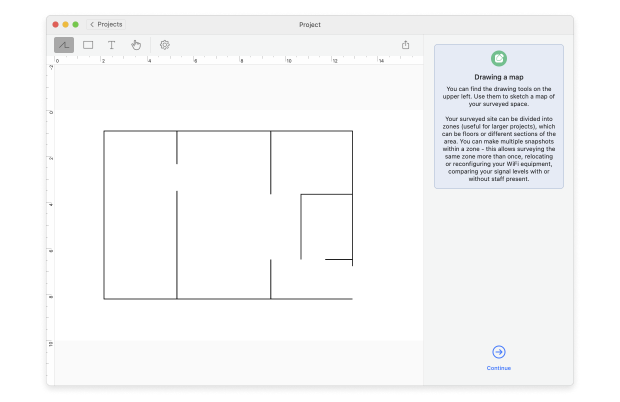
Use the drawing tools provided to outline your space. When you’re satisfied with your drawn map, click Continue.
Step 6
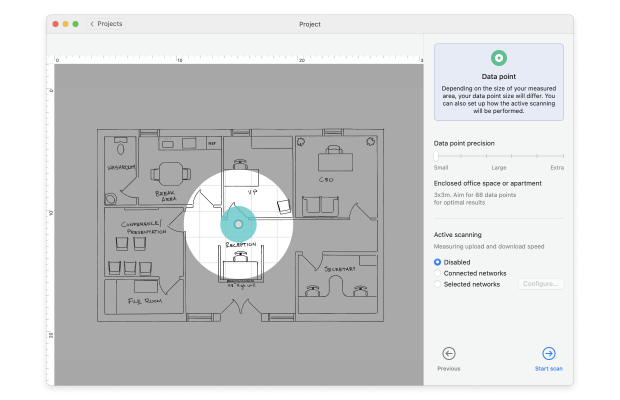
Now you need to specify the data point size. This determines the distance between sampling points during your survey and affects the granularity and accuracy of your heatmap. At this point, you can also choose to enable active scanning to measure the upload and download speed. When you’re done, you can click Start scan to proceed.
Step 7
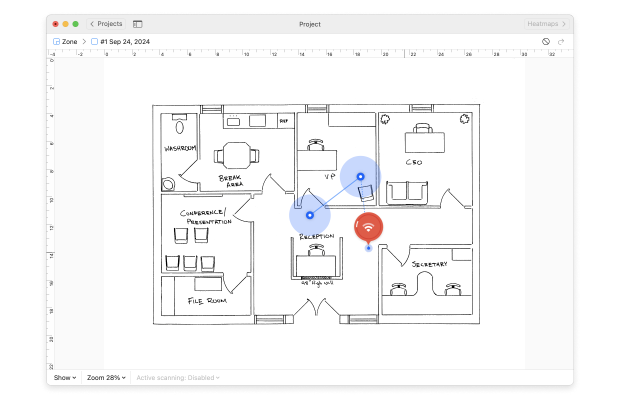
Move from one area to the next until the entire map is covered with overlapping blue circles, which is when you can click the “Heatmaps” button. These circles represent the data points collected during your survey, ensuring comprehensive coverage of your space.
Step 8
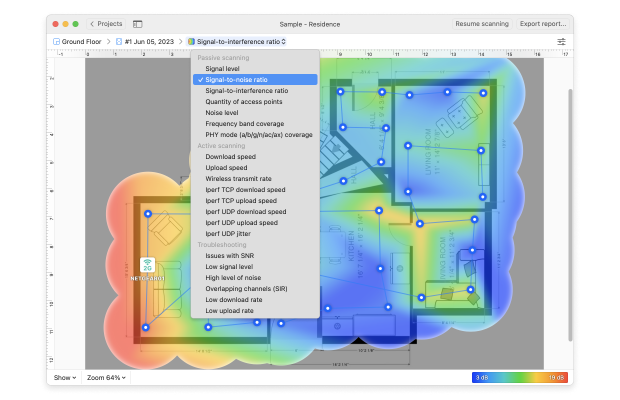
Analyze the Wi-Fi heatmap. You can switch to other visualizations using the drop-down menu at the top of the screen to examine different aspects of your wireless network, such as signal strength, noise levels, and channel overlap.
Look for color-coded indicators, where warmer colors (reds and oranges) signify stronger signals, and cooler colors (blues and greens) indicate weaker signals. Identify dead zones with no coverage and areas with overlapping signals, which may cause interference.
Assess the placement of routers and access points to ensure optimal coverage and minimal interference. Use the Wi-Fi heatmap data to make adjustments, such as repositioning devices or adding additional access points, to improve overall Wi-Fi performance and reliability.
Good to know: For more advanced users, NetSpot also offers a WiFi Planning mode, allowing you to design and simulate new network layouts before implementation.
Wi-Fi Heatmaps and Visualizations
Wi-Fi heatmaps are an essential wireless signal visualization tool that can help you understand how the signal covers your designated space, where the signal doesn't quite reach, and what improvements can be applied. We've tagged heatmaps that are also available in NetSpot's predictive surveys with **.
Passive scanning
Signal-to-noise ratio
Visualization of the correlation of the Wi-Fi signal strength to the background noise, where the noise is the interference measured at each sampling point.
Signal level **
Visualization of the wireless signal strength throughout the space. It is to be used as a reference when analyzing the signal strength correlation to other factors in effect.
Signal-to-interference ratio **
Visualization of the Wi-Fi signal disruption or interruption by various devices, other networks, physical obstructions, etc.
Secondary signal level **
Shows the second strongest Wi-Fi signal strength (measured as RSSI) detected at a specific measuring point. By analyzing this signal level, you can see how the secondary signal covers your space, where the clients may have inefficient switch between the APs, and experience degraded WiFi performance.
Quantity of access points **
Shows all detectable Access Points forming the surveyed/planned Wi-Fi network.
Noise level
Visualization of the level of outside noise affecting the space as detected at each measurement point.
Frequency band coverage **
Allows for visual analysis of different frequencies available in various measurement points.
PHY mode coverage **
Visualization of the PHY Mode types (802.11a/b/g/n/ac/ax/be* modes) used in the surveyed network.
Active scanning
Upload speed
Upload speed heatmap visualizes the rate of data transfer from computer to the Internet in each measurement point.
Download speed
Download speed heatmap visualizes the rate of data transfer from the Internet to computer in each measurement point.
Wireless Transmit rate
Also known as TxRate, this visualization shows the speed of data transfer from an AP to a wireless device.
Iperf3 upload, download, and jitter visualizations
If using the Iperf3 tool for bandwidth performance testing, you can visualize upload, download, and jitter in NetSpot for macOS.
Troubleshooting
Issues with SNR
This type of heatmap allows you to easily spot the areas with the low SNR level that can affect your network connectivity.
High level of noise
The higher noise levels can negatively affect the wireless signal strength, from lowering it to causing "dead zones" with virtually non-existent coverage.
Low signal level **
Spot the areas where the signal is so low it's practically not present. Addressing the low signal issues can help even out the coverage.
Overlapping channels (SIR) **
Visualize different networks transmitting on the overlapping channels, which can cause a loss of network coverage performance.
Low secondary signal level **
This heatmap allows you to visually assess the areas with a low secondary wireless signal. Based on the results you will be able to see what adjustments you could make in order to improve your secondary wireless setup.

What Is the Purpose of Creating a Wi-Fi Heatmap?
The purpose of creating a Wi-Fi heatmap is to obtain accurate information about the quality of coverage of a Wi-Fi network. As you may know, Wi-Fi coverage is affected by many different factors, including:
- Your Wi-Fi router: There are many different Wi-Fi routers, and the quality of coverage they provide varies greatly. You can’t reasonably expect a budget Wi-Fi router to cover a large home or office building with a strong Wi-Fi signal no matter how well you position or configure it. A Wi-Fi heatmapping tool can help you understand the limitations of your Wi-Fi router and decide if you should get a new one. Modern Wi-Fi routers have plenty of useful features intended to improve your online experience, so upgrading once in a few years is typically always a good decision.
- Other Wi-Fi networks: Being stuck in traffic on your way to work is no fun, especially if you’re in a hurry and need to get there as quickly as possible. Unfortunately, something similar can happen to you when surfing the web, downloading files from the internet, or video chatting with friends because digital traffic jams can occur when too many Wi-Fi networks in the same area broadcast on the same frequency and channel. Using a Wi-Fi heatmapping software application, you can visualize frequency band coverage and configure your router accordingly.
- Antenna orientation: The direction and angle of your router's antennas can significantly affect signal distribution. Wi-Fi heatmaps can help you optimize antenna positioning for better coverage.
- Physical obstacles: Your Wi-Fi signal doesn’t like physical obstacles, especially those that are dense and thick, such as walls or large furniture. Materials like metal can also have a significant impact on your wireless signal, which is why you should never install a Wi-Fi router near metal appliances. In extreme cases, physical obstacles can create dead zones, which can be clearly seen on a Wi-Fi heatmap. Unfortunately, not all physical obstacles can be easily removed. You can, however, always improve your Wi-Fi signal by installing a Wi-Fi extender or additional router.
- RF interference: Radio frequency interference, also called electromagnetic interference, refers to the disturbances in the Wi-Fi frequency spectrum (usually 2.4 GHz and 5 GHz) caused by RF-emitting devices. Such devices include cordless phones, mobile phones, microwave ovens, medical scanner, baby monitors, wireless security cameras, and, of course, Wi-Fi routers themselves. RF interference can manifest itself on a Wi-Fi heat map as an area of signal weakness, and it typically correlates with the presence of some electronic device.
- Time-based variations: Network performance can change throughout the day due to varying usage patterns or interference sources. Creating heatmaps at different times can provide insights into these temporal fluctuations.
- Router configuration: Your Wi-Fi router has many different settings that you can change to improve the quality of its signal. The main setting you should pay attention to is your Wi-Fi channel. In the 2.4 GHz band, there are 11 channels (at least in North America), with channels 1, 6, and 11 being the only non-overlapping channels. You should also pay attention to your router security settings, because the last thing you want is to let other people use your internet connection without your approval. Most Wi-Fi heat map software solutions can gather information about the configuration of your router, as well as other routers in the area.
Ultimately, the goal of creating a Wi-Fi heatmap is to gain actionable insights for addressing these factors and optimizing your network. Whether you aim to troubleshoot connectivity problems, fine-tune router placement, mitigate interference, boost speeds, or simply plan the addition of extenders or upgrades — a heatmap empowers you to move from guesswork to informed decision-making.
Conclusion
Wi-Fi heatmaps are essential tools for anyone looking to optimize their wireless network performance. They provide a visual representation of your Wi-Fi coverage, highlighting areas of strong signal and pinpointing dead zones or interference sources.
With their help, you can make informed decisions about router placement, network configurations, and potential upgrades to achieve comprehensive and efficient coverage. And with user-friendly tools like NetSpot, both professionals and home users can generate them with ease.
SO, WE RECOMMEND

NetSpot
Get NetSpot for Free
Wi-Fi Site Surveys, Analysis, Troubleshooting runs on a MacBook (macOS 11+) or any laptop (Windows 7/8/10/11) with a standard 802.11be/ax/ac/n/g/a/b wireless network adapter. Read more about the 802.11be support here.