Wi-Fi Site Surveys, Analysis, Troubleshooting runs on a MacBook (macOS 11+) or any laptop (Windows 7/8/10/11) with a standard 802.11a/b/g/n/ac/ax wireless network adapter.
NetSpot: Wi-Fi Network Detector and Manager
NetSpot is a great tool to manage your
wireless network.
NetSpot allows you to detect all of the Wi-Fi hotspots in your area and determine where the best place to position your access points is. It also helps you find the best WiFi channel for your router.
Jump to...
How to Manage Your Wireless Network With NetSpot
When it comes to WLAN management, NetSpot simplifies the process. From identifying weak signals to optimizing coverage. Whether you’re troubleshooting a home connection or managing a business network, NetSpot gives you the insights you need to take control.
Here’s how NetSpot can help:
- Scan all available Wi-Fi networks, including hidden ones, so you get a full picture of your surroundings.
- Create Wi-Fi heatmaps that show signal strength across different areas, making it easy to identify dead zones.
- Analyze interference and noise, helping you pinpoint what’s affecting your connection.
- Find the best Wi-Fi channel to avoid congestion and improve stability.
- Monitor signal strength over time, allowing you to track performance and make adjustments.
Here’s how you can take control of your wireless network step by step.
Step 1
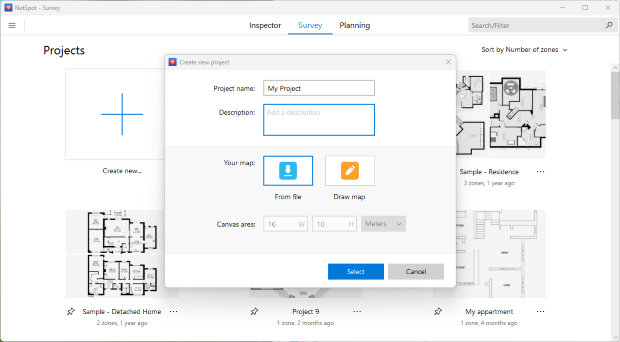
Download and Run NetSpot
Download and install NetSpot on your device, then open the program and upload a floor plan in GIF, JPEG, PNG, TIFF, or PDF format. If you don’t have a map, you can draw your own layout directly in NetSpot.
Step 2
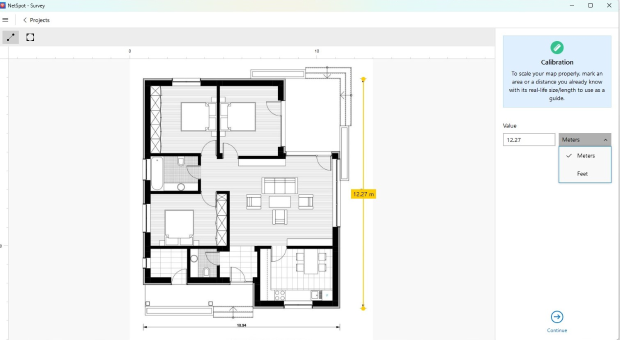
Calibrate Your Floor Plan
Once the floor plan is uploaded or drawn, you need to calibrate it by setting the correct scale. This ensures that all measurements reflect the actual dimensions of the space, allowing for precise network optimization. Select the appropriate units — meters or feet — to match real-world distances.
A well-calibrated map improves the accuracy of heatmaps and signal analysis, making it easier to pinpoint weak spots and optimize coverage effectively.
Step 3
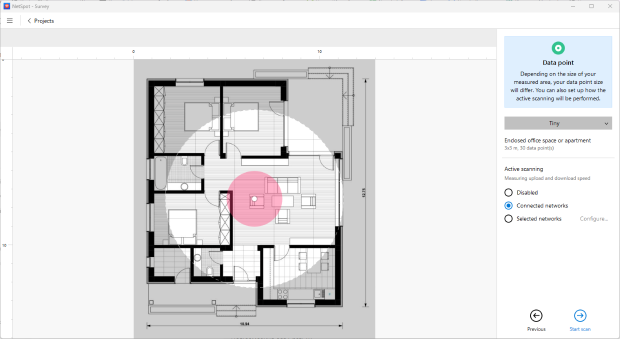
Complete your Scan
For Active Scanning, which measures real-time upload and download speeds, select the preferred scanning type in NetSpot’s settings. You can either measure performance for all connected networks or specify selected networks by configuring them manually. If speed data is not required, you can disable Active Scanning.
Start scanning by walking through the area and placing data points on the floor plan. Ensure an even distribution, moving systematically from one side to the other, covering all critical locations where devices connect to the network. The more data points you add, the more precise and reliable your coverage map will be.
For more detailed instructions on starting your Wi-Fi survey, follow the directions in NetSpot Knowledgebase. How do I start my Wi-Fi survey?
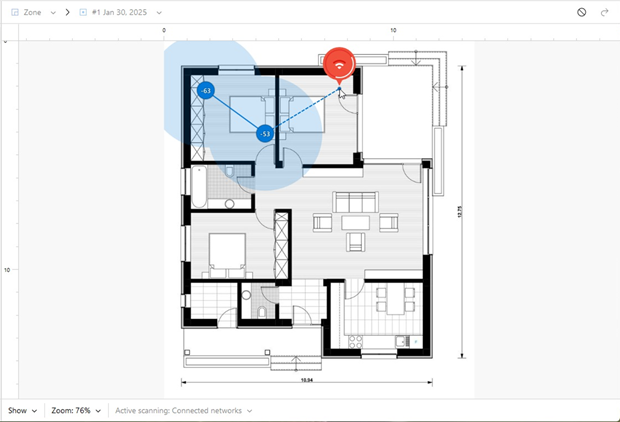
Step 4
Isolate Your Network
To get accurate data on your network’s performance, it’s essential to remove unnecessary information about other access points. In NetSpot, you can isolate your network by unchecking other networks in the list. This ensures that your analysis focuses solely on your own Wi-Fi without external data cluttering the results.
If your network has multiple access points, you may want to analyze them separately to understand how each one contributes to overall coverage. This is especially useful in large homes or office environments where different access points serve different areas.
By isolating your network, you gain a clearer picture of your signal strength, coverage, and any weak spots that need attention, allowing for more precise adjustments and optimizations.
Step 5
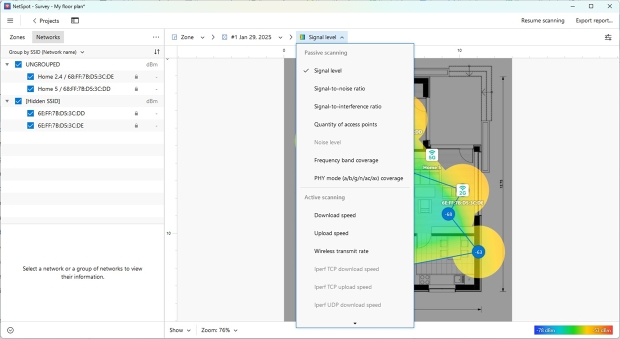
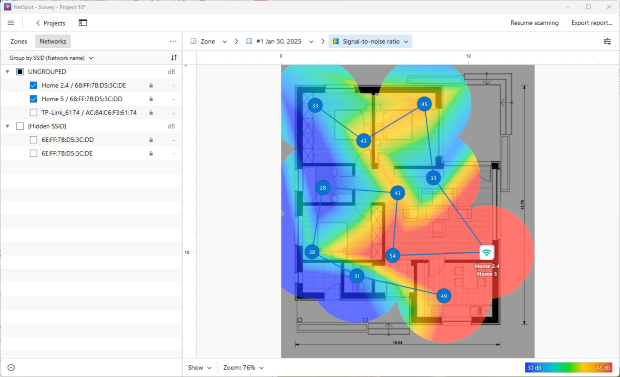
Analyze the Heatmap
NetSpot provides nearly 20 different heatmaps, allowing for a detailed analysis of Wi-Fi performance. The most informative visualizations for assessing your network include:
- Signal Level — shows the strength of the Wi-Fi signal in different areas, helping to identify weak coverage zones.
- Signal-to-Noise Ratio (SNR) — indicates the difference between signal strength and background noise. Dark blue and purple zones highlight weak signal areas.
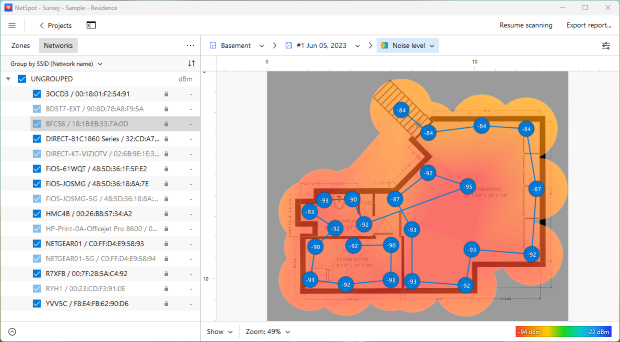
- Noise Level — helps identify interference sources such as household appliances, Bluetooth devices, and neighboring networks.
- Band Coverage — displays the distribution of 2.4 GHz, 5 GHz, and 6 GHz bands, showing which frequency provides the best coverage.
By leveraging these heatmaps, you can identify dead zones, assess the impact of interference, and optimize your network setup more effectively.
Step 6
Addressing Network Issues Based on Your Findings
Once you’ve analyzed your Wi-Fi survey results, take steps to resolve any issues identified.
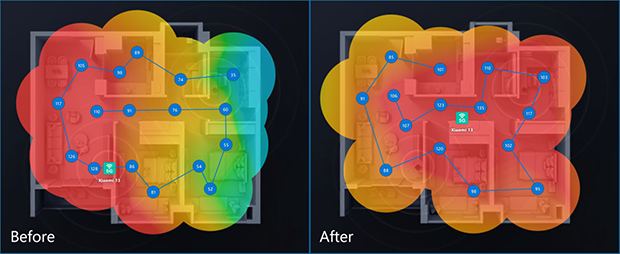
- Relocate an Access Point: If weak signal areas suggest that the router’s placement is causing coverage gaps, consider repositioning it. Move the router to a more optimal location and run another scan to compare the results. NetSpot allows you to create a new snapshot for the same area, making it easy to evaluate improvements.
- Identify Sources of Interference: If relocating the router isn’t an option, focus on eliminating interference. Use the Noise Level heatmap by selecting this visualization from the drop-down menu to pinpoint problem areas. Identifying and reducing sources of interference, such as electronic devices or neighboring networks, can significantly improve signal quality.
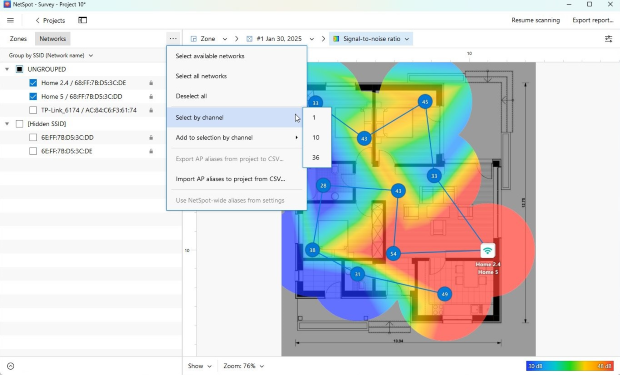
- Consider Switching Channels: If interference from overlapping networks is affecting performance, adjusting your channel settings may help. Click the three-dot menu in the upper left corner to open the panel, then choose “Select by channel” to pick networks operating on specific channels and determine the best option for your Wi-Fi. Once you’ve determined the best channel, go to your router’s configuration settings and update the Wi-Fi channel to minimize interference and improve network stability.
By determining the correct router location and channel, you are well on your way to successfully managing your Wi-Fi network. WLAN managers like NetSpot are a critical part of optimizing your wireless network.
NetSpot Wi-Fi Manager will
- Help you configure your wireless network
- Tune WiFi network of any size
- Help improve WLAN network
- Visualize and scan WLAN site
- Scan Wi-Fi and visualize its coverage
- Act as a versatile WiFi managing app
SO, WE RECOMMEND

NetSpot
FAQ
How to Manage Your Wireless Network with NetSpot?
NetSpot is a versatile app that won't only help you identify any possible issues with Wi-Fi, but is also very helpful for monitoring of the signal strength and the consistency of coverage. We highly recommend to follow these steps once a month:
Step 1
Scan the neighboring networks and isolate yours for a deeper analysis. If you are happy with the results, close NetSpot and analyse your network again in a month.
Step 2
If there are issues, identify their sources and follow the instructions given to you by NetSpot.
Are there any map recommendations?
Get the best results with your WiFi maps with NetSpot. Use the following tips as your guidance. To import a map to NetSpot, save it in one of the following formats: GIF, JPEG, PNG, TIFF or PDF (but only the first page of a multi-page PDF). It is recommended to have maps in blacn and white with a white background.
If you are going to scan a very large area, break it into sections and upload those sections as separate zones. A recommended max size of a map is 3000 x 2000 pixels. Larger maps are processed better on laptops with more RAM, if you feel like your laptop is struggling, try decreasing the size of your map.
What can I do if I don't have a map?
If you don’t yet have a map to upload, you can do the following:
- Draw a new map in NetSpot;
- Ask the building owner or the local County Clerk's office for a copy of blueprints. Scan and save them on your computer;
- Draw a map with a pencil on graph paper and scan it;
- Create a map with an app such as My Four Walls, MagicPlan for iOS, or CamToPlan for Android that were recommended by other NetSpot users.
Why do I need to manage my wireless network?
Consistent management of a WiFi network allows you to keep its performance in top shape and efficiently use your resources, such as access points.
Get NetSpot for Free
Wi-Fi Site Surveys, Analysis, Troubleshooting runs on a MacBook (macOS 11+) or any laptop (Windows 7/8/10/11) with a standard 802.11a/b/g/n/ac/ax wireless network adapter.