Wi-Fi Site Surveys, Analysis, Troubleshooting runs on a MacBook (macOS 11+) or any laptop (Windows 7/8/10/11) with a standard 802.11be/ax/ac/n/g/a/b wireless network adapter. Read more about the 802.11be support here.
How SNR Affects Your Wi-Fi and How to Enhance It
Discover how Signal-to-Noise Ratio (SNR) affects your Wi-Fi speed and stability, and learn effective ways to improve it for a stronger, more reliable connection.
Has your Wi-Fi ever slowed down even when you’re sitting right next to the router? The problem might not be with the router itself, but with invisible interference affecting your network. This issue is known as the Signal-to-Noise Ratio (SNR), and it plays a crucial role in determining how clear and strong your WiFi signal is.
In this article, we’ll break down what SNR is, how it influences your internet speed, and how you can measure and improve it for a stronger, more stable connection.
Jump to...
What is SNR and How Does It Affect Connection Quality
SNR (Signal-to-Noise Ratio) measures the strength of your Wi-Fi signal compared to background noise. It is expressed in decibels (dB), calculated as the difference between the signal power and the noise power. A higher SNR means a cleaner, stronger signal, while a lower SNR indicates more interference relative to the signal strength.
Imagine trying to find a lighthouse beacon through a thick mist. The brighter the light, the easier it is to see, but as the fog gets denser, the light fades into the haze. That's exactly how interference affects your Wi-Fi signal. The denser the fog, the harder it is to make out the words. In Wi-Fi terms, a low SNR means your device struggles to distinguish the signal from interference, leading to slow speeds, unstable connections, and frequent dropouts.
But what exactly causes this interference? To answer that, we need to explore the different types of noise that can affect your Wi-Fi connection.
Types of Noise Affecting Wi-Fi:
- Thermal Noise: Stemming from the internal workings of electronic circuits and shifts in temperature.
- Impulse Noise: Short bursts of disruptive energy often tied to household gadgets like microwaves or even nearby power lines.
- Intermodulation Noise: Occurs when several wireless signals overlap, creating interference that muddles your connection.
A higher SNR indicates a cleaner, stronger signal, which directly impacts:
- Internet Speed: Faster browsing, streaming, and downloads.
- Connection Stability: Reduced lag and fewer disconnections during video calls.
- Network Reliability: Fewer errors and improved data transmission efficiency.
To better understand how Signal-to-Noise Ratio (SNR) affects connection quality, let’s look at two graphs.

High SNR Graph
The first graph shows high SNR, where the signal (green line) clearly stands out above the noise (red dashed line). This means a strong, stable connection with fast data transfer and minimal interference.

Low SNR Graph
In the second graph, low SNR is depicted. Here, the signal barely rises above the noise level, leading to unstable connections, slower speeds, and frequent data loss.
Although real-world signals are more complex, the key takeaway remains the same: strong signals with minimal noise ensure the best performance. In real-time monitoring tools like NetSpot, SNR values constantly fluctuate due to environmental factors, device movement, and varying sources of interference.
How to Measure and Calculate SNR
To measure SNR effectively, you can use tools like NetSpot for Mac, which offers detailed network analysis.
- Download and install the application from the official website.
- Launch the app after installation, then choose Inspector Mode to begin analyzing your Wi-Fi network.
- Scan Networks and select the target Wi-Fi network for analysis.
- Review the displayed “Signal Level” and “Noise Level.”
- You can determine SNR by applying the formula below or right-clicking on a table header to add the SNR column and see the result directly.
SNR (dB) = Signal Strength (dBm) – Noise Level (dBm)
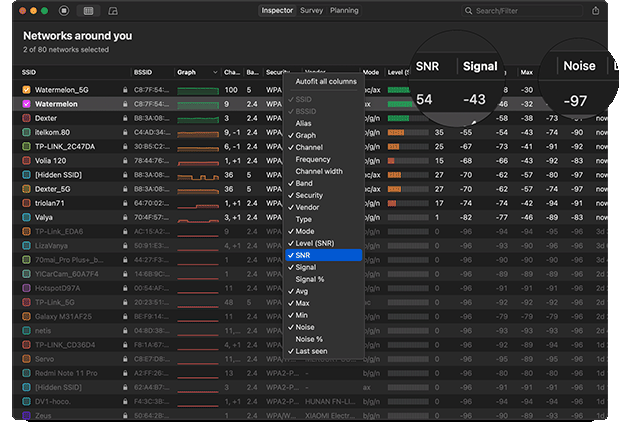
Let’s break down a real example from the screenshot. Suppose your signal strength is -43 dBm, and the noise level is -97 dBm. To calculate the Signal-to-Noise Ratio (SNR), you subtract the noise from the signal:
SNR = -43 - (-97) = 54 dB
An SNR of 54 dB is considered excellent, meaning your connection should be stable with fast data transmission and minimal interference.
Additionally, NetSpot can visually represent SNR using heatmaps. This feature helps you identify areas with poor signal quality and potential interference, making it easier to optimize your network setup.

NetSpot — SNR heatmap
Now that you know how to measure and calculate SNR, it’s time to understand what these numbers actually mean for your Wi-Fi performance. SNR values aren’t just technical data — they directly influence the quality of your connection.
SNR Parameters, Their Applications, and How to Improve Poor Values
Understanding SNR values helps you determine the quality of your Wi-Fi connection and what activities it can support. Here’s a breakdown of different SNR ranges, their impact on performance, and how they affect your online experience.
| SNR Range (dB) | Less than 10 |
| Connection Quality | Unusable |
| Common Issues | Constant drops, no reliable connection |
| Best Use Cases | Barely functional Wi-Fi, emergency use only |
| SNR Range (dB) | 10 - 15 |
| Connection Quality | Poor |
| Common Issues | Frequent buffering, unstable connection |
| Best Use Cases | Limited browsing, non-critical tasks |
| SNR Range (dB) | 15 - 25 |
| Connection Quality | Fair |
| Common Issues | Occasional lag, slower speeds |
| Best Use Cases | Basic web usage, standard video calls |
| SNR Range (dB) | 25 - 40 |
| Connection Quality | Very Good |
| Common Issues | Rare interruptions |
| Best Use Cases | HD streaming, video calls, web browsing |
| SNR Range (dB) | 40 + |
| Connection Quality | Excellent |
| Common Issues | None |
| Best Use Cases | 4K streaming, online gaming, large file transfers |
If your SNR values are poor, consider the following improvements:
- Optimize Router Placement: Place the router centrally and elevate it for better coverage.
- Reduce Interference: Minimize interference by placing the router away from electronic devices and metal objects.
- Adjust Wi-Fi Channels: Use NetSpot to identify less congested channels.
- Upgrade Equipment: Consider dual-band or mesh systems for improved signal quality.
- Firmware Updates: Regularly update router firmware to maintain optimal performance.
- Advanced Techniques: Use directional antennas, adjust transmission power, and consider MIMO technology for further optimization.
Conclusion
Maintaining a high SNR is crucial for a fast, stable Wi-Fi connection. Regular monitoring with tools like NetSpot allows you to identify and address issues proactively. By optimizing router placement, reducing interference, and upgrading equipment when necessary, you can ensure reliable performance for all your online activities.
SO, WE RECOMMEND

NetSpot
Get NetSpot for Free
Wi-Fi Site Surveys, Analysis, Troubleshooting runs on a MacBook (macOS 11+) or any laptop (Windows 7/8/10/11) with a standard 802.11be/ax/ac/n/g/a/b wireless network adapter. Read more about the 802.11be support here.